I added a data page so you can see everything the Bullion API offers
The Bullion API has more than metal prices. I built a data page that lists every dataset, including the central-bank and rates data that moves gold.
On this page
The Bullion API holds more than metal prices, but you couldn't see that in one place. The docs list endpoints. They don't show the range of data behind them.
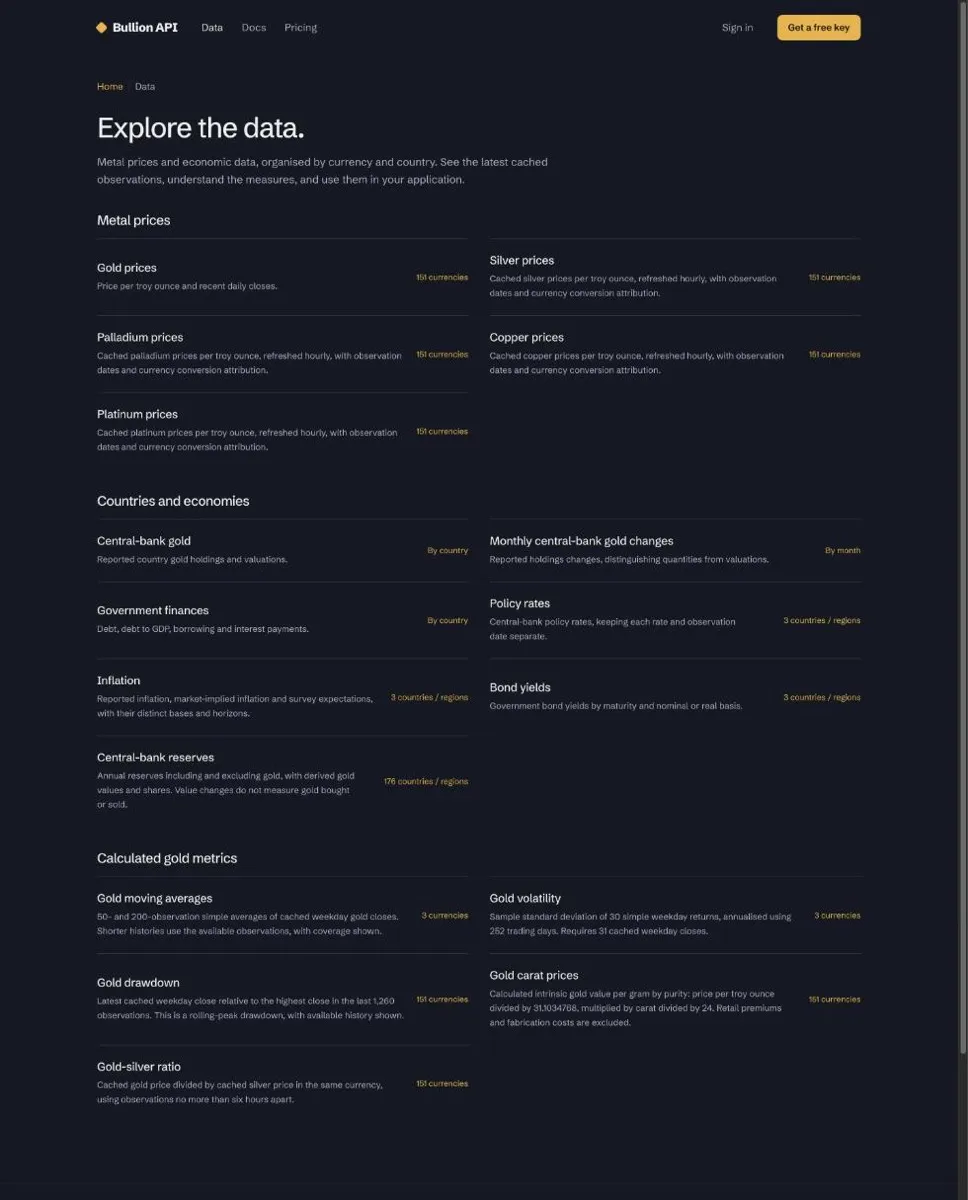
So I built a data page. It lists everything the API has, in three groups.
Metal prices
Gold, silver, platinum, palladium and copper, each priced per troy ounce in 151 currencies. The prices are cached and refreshed hourly, so they are not live. The page says so.
Countries and economies
I added this group because central banks, interest rates and inflation are what move the price of gold and silver. A price on its own doesn't tell you why it moved.
- Central-bank gold: reported holdings for 38 countries, with monthly changes back to January 2017.
- Central-bank reserves: annual reserves for 176 countries and regions, with and without gold.
- Government finances: debt, debt to GDP, borrowing and interest payments.
- Policy rates, inflation and bond yields: for the US, the UK and the euro area.
Calculated gold metrics
Moving averages, volatility, drawdown, carat prices per gram and the gold-silver ratio. These are worked out from the cached prices.
Holdings are not purchases
The decision I care about most is on the central-bank pages. A change in reported holdings looks like a country buying or selling gold. It often isn't. The number can move because of revaluations, revisions or reclassification.
I kept holdings separate from purchases and said so on the pages. The same goes for reserves: a change in value does not measure gold bought or sold. I would rather the page be plain about this than let someone read a purchase into a bookkeeping change.
Government debt has a similar problem. Scopes, periods and definitions differ between the US, the UK, the euro area and the EU member states, so the page says the figures can't be compared across geographies. I haven't solved that. Some countries also show no data yet.
What is missing
There are no historical graphs on the data page. You can't compare one country with another either. Those are what I want to add next.
Get notified when I ship something new.
A weekly newsletter on React, Next.js, AI-assisted development, and engineering. No spam, unsubscribe any time.