Lookout gets a new design, and Satzo adds cost methods and NFTs
Lookout has a new design, from the signed-in app to the public pages and the emails. Its waitlist is open, and it now brings in keyword data from outside Search Console. Satzo works out the profit and loss on your crypto wallets, and now has a choice of cost method, five new exchange imports and NFTs. Switchboard has one layout across the app, automations you can start from a ready-made starter, and help with the DNS records you need to send email. Bullion API has three new setup guides and adds Sweden.
Lookout
Lookout watches a website for search problems: pages Google can't crawl, slow pages, broken structured data, and drops in search traffic. It tells you what to fix first. It now has a new design, and a few screens work differently. The screenshots below use a demo project, example.com.
The waitlist is open
You can now join the Lookout waitlist from the home page. Leave your work email, how many sites you look after, and whether you are a freelancer, an agency, an in-house team or a site owner. I invite people in small groups, and an invite lasts 7 days.
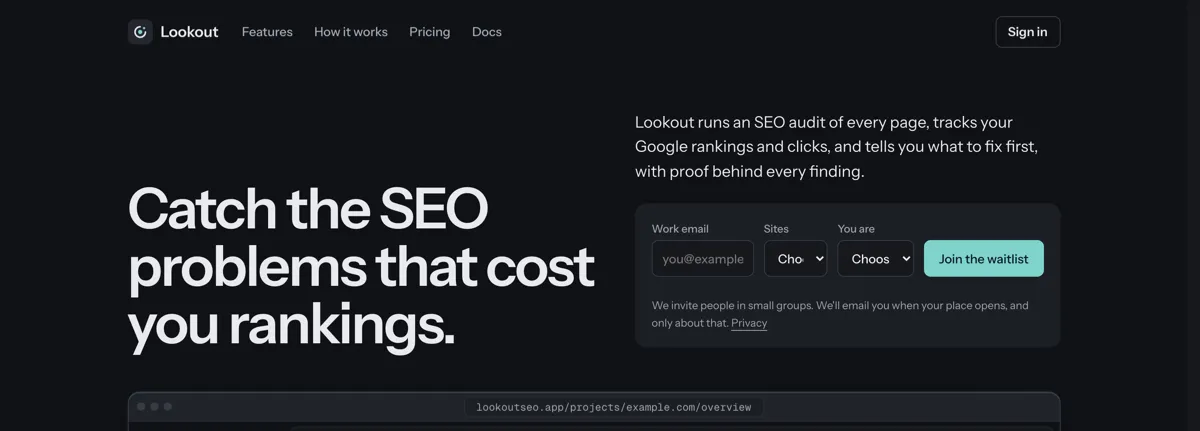
A new design, in light and graphite
The new design reaches four parts of Lookout:
- The signed-in app, in a light theme and a dark one called graphite.
- The public pages: the home page, pricing, the docs, sign-in, the contact, legal and password pages, and the 404 page.
- The emails: alerts, the weekly digest and the account emails.
- The screenshots in the docs, taken again in both themes.
Status is now shown as a coloured dot with a word, and Lookout has a new logo.
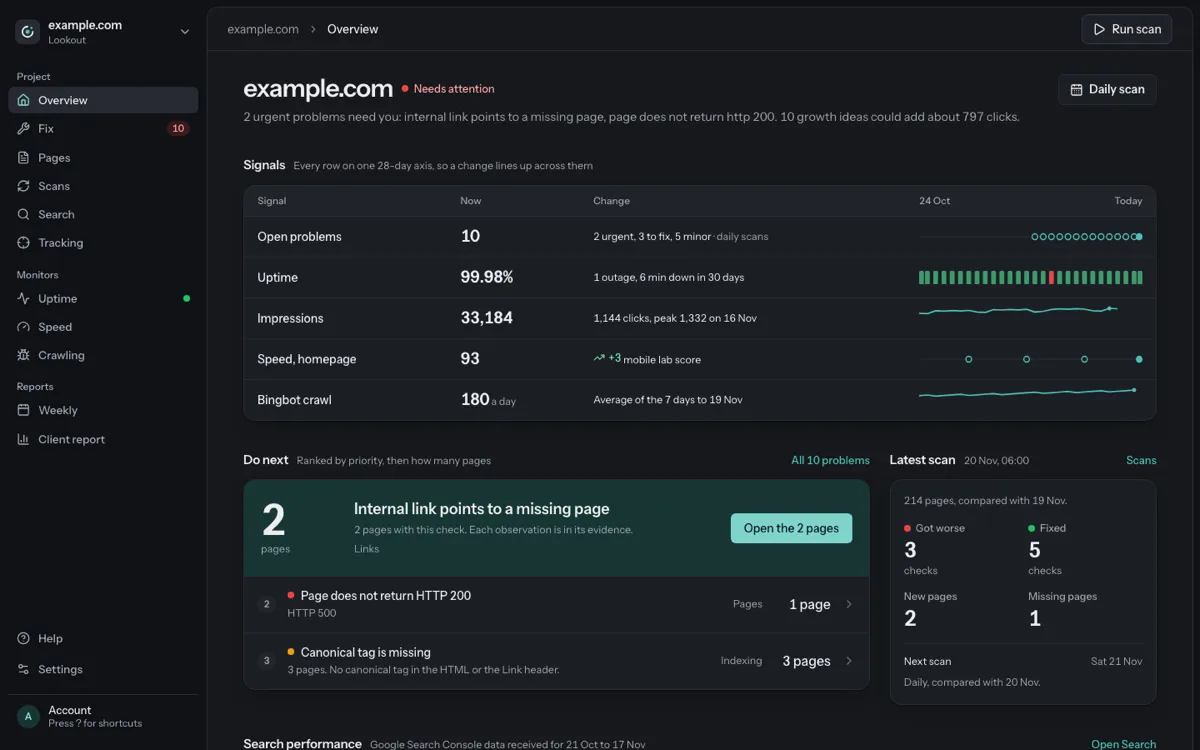
The Overview tells you what to do next
A project's Overview now opens with two things: a Signals table and a Do next list.
The Signals table has one row each for open problems, uptime, search impressions, homepage speed and how often Bing crawls the site. Each row shows the latest value, what changed, and the last 28 days as a small chart, all on the same timeline. Google's ranking updates are shaded at the same dates on every row, so you can see whether a change lines up with one.
Do next shows the three problems to fix first. They are ranked by priority, then by how many pages they affect, then by which is newest. The first one is shown large, with a button to open the pages it affects.
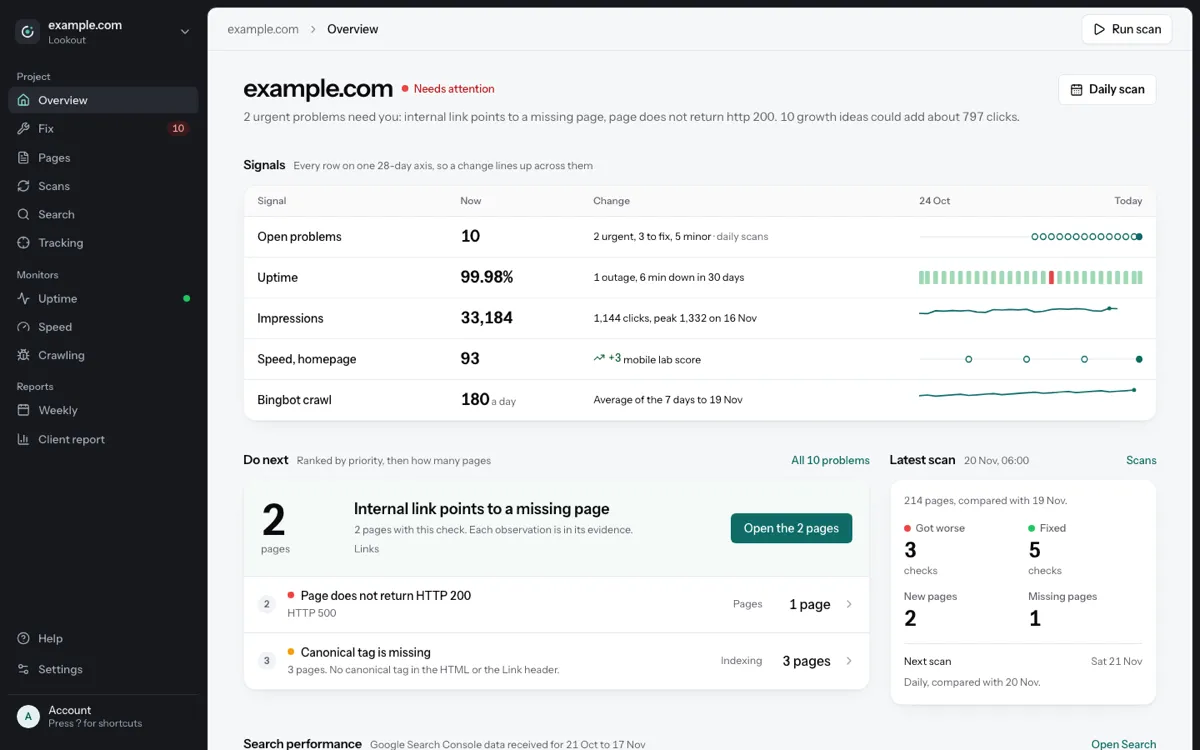
Beside Do next is the latest scan, compared with the one before. Below them are your search performance over 7 days, 28 days or 3 months, where the problems are on the site, and the latest Google ranking updates.
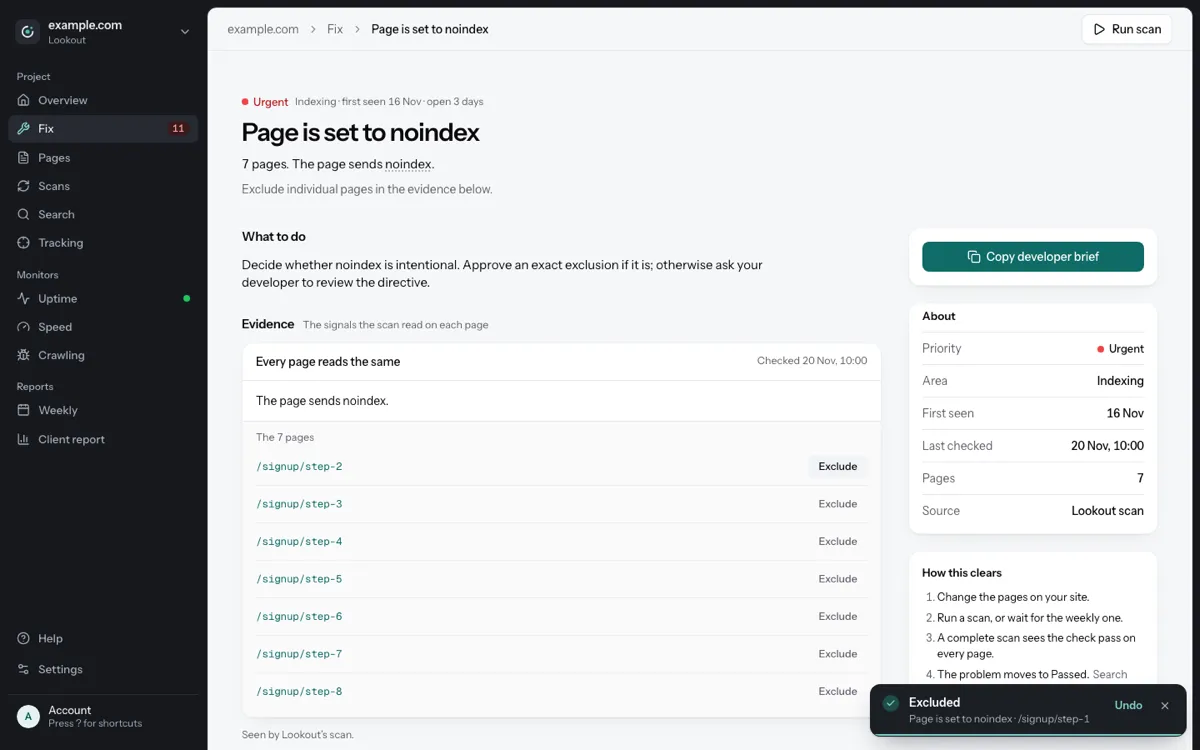
Excluding a problem, with Undo
Sometimes a problem is there on purpose, such as sign-up pages that are set to noindex. You can exclude it, and it takes effect straight away. A message pops up with Undo in case you change your mind. Exclude still works one page at a time.
The problem pages themselves are rebuilt too. Each kind of problem shows its own evidence in its own columns. A layout shift (CLS) problem shows the device and the CLS score, and a speed drop shows the score before and now. Missing structured data shows each item and what it is missing.
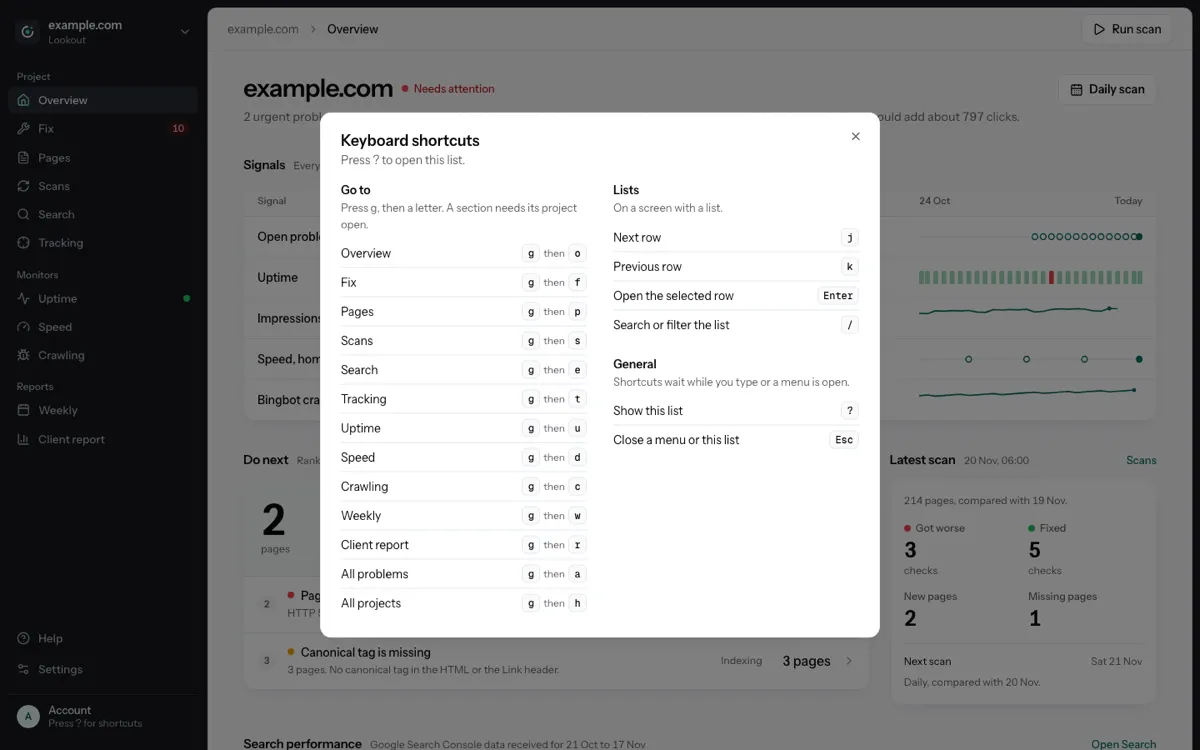
Keyboard shortcuts
Lookout now works from the keyboard:
- Press g then a letter to jump to a screen.
- Press j and k to move down and up a list, and Enter to open the row.
- Press / to search or filter the list.
- Press ? to see every shortcut.
The foot of the side menu says "Press ? for shortcuts", so you don't have to remember it.
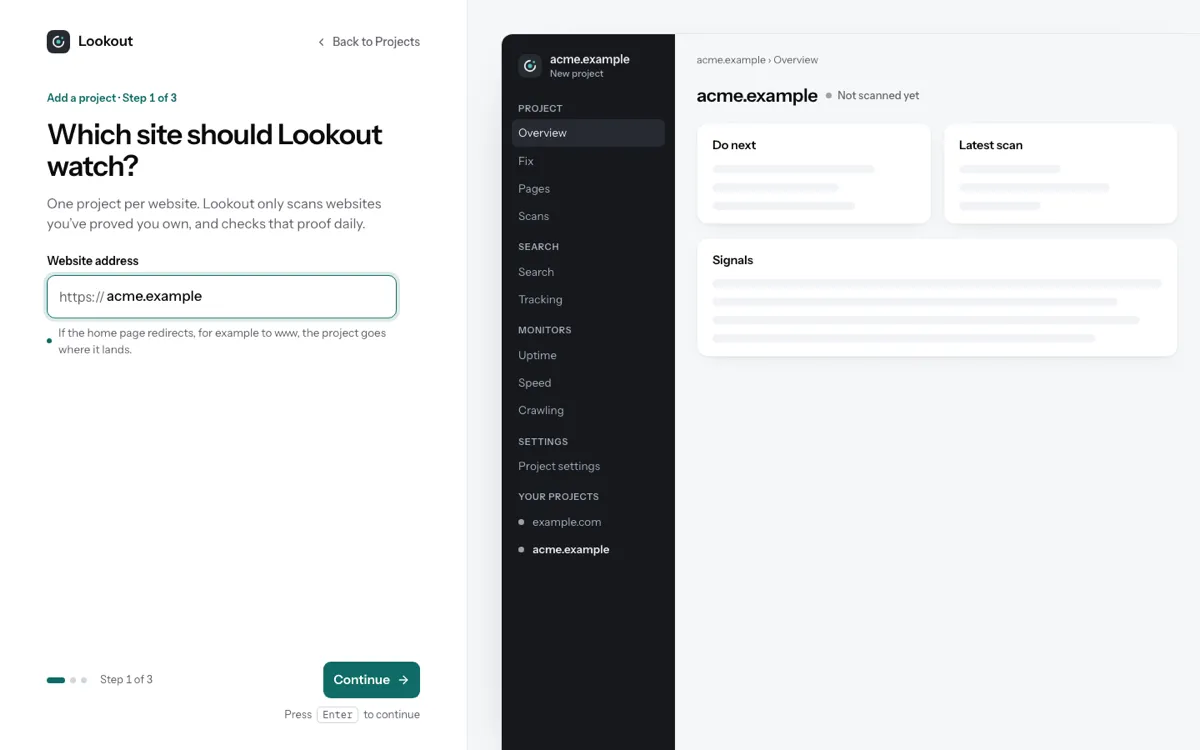
Adding a project, one question at a time
The welcome screen and Add a project now ask one question per step. Press Enter to go to the next one. On a wide screen, a preview on the right shows the project taking shape as you answer.
While the first scan runs, the Overview shows how many pages have been read, with a progress bar. It also shows what is already running for you, such as uptime checks and the scan schedule.
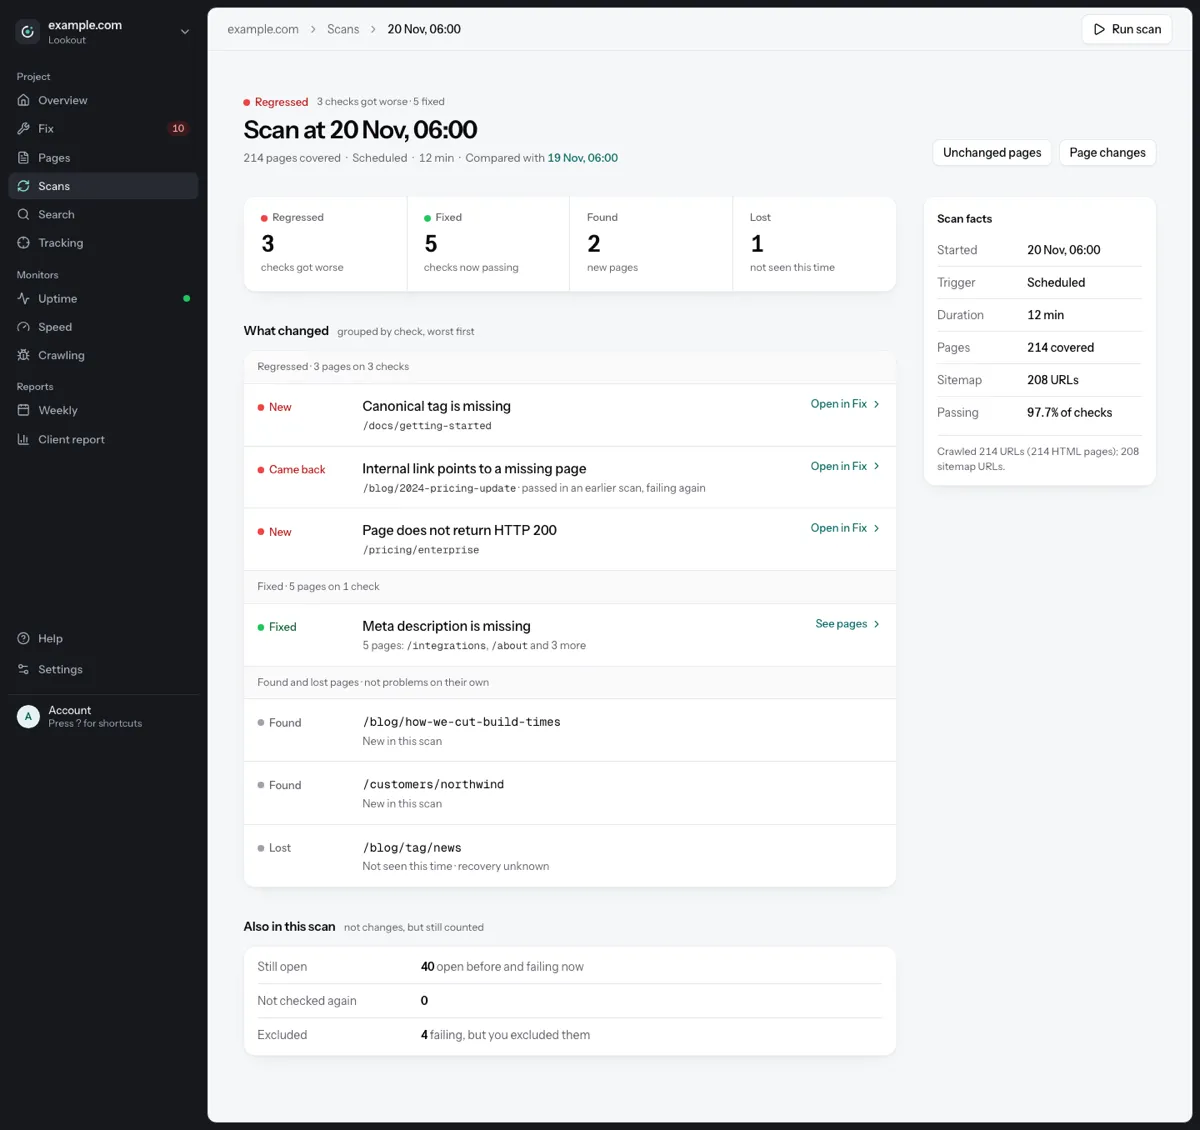
What changed in a scan
A scan's page now shows one "What changed" list, grouped by check. Checks that got worse come first, worst first, then the ones that got fixed. Each problem that got worse links to the problem in Fix. Pages that appeared or went missing are folded by folder, so "20 pages under /gone not seen this time" takes one line, not twenty.
Weekly, the client report and Changes
Weekly now has a "Do this week" section, tinted by the item's priority. Its change tables sit side by side on a desktop and stack on a phone. The client report and the Changes screen are on the new design too. On Changes, each row has a risk dot and opens the page's before and after.
Bing gets its own page
Bing now has its own page under Search. It shows Bing's impressions and clicks for the last 90 days, a daily chart, crawl issues, blocked URLs and Bing's crawl settings. Setting up the connections to Google Search Console and Bing has moved to Settings, under Connections.
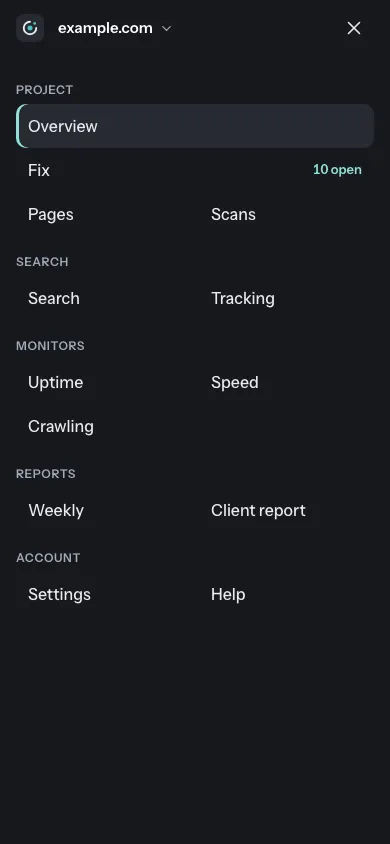
On a phone
On a phone, Lookout has a top bar and a full-screen menu.
Keyword data from outside Search Console
Search Console tells you how your site already does in Google. Lookout now brings in data that Search Console can't give you:
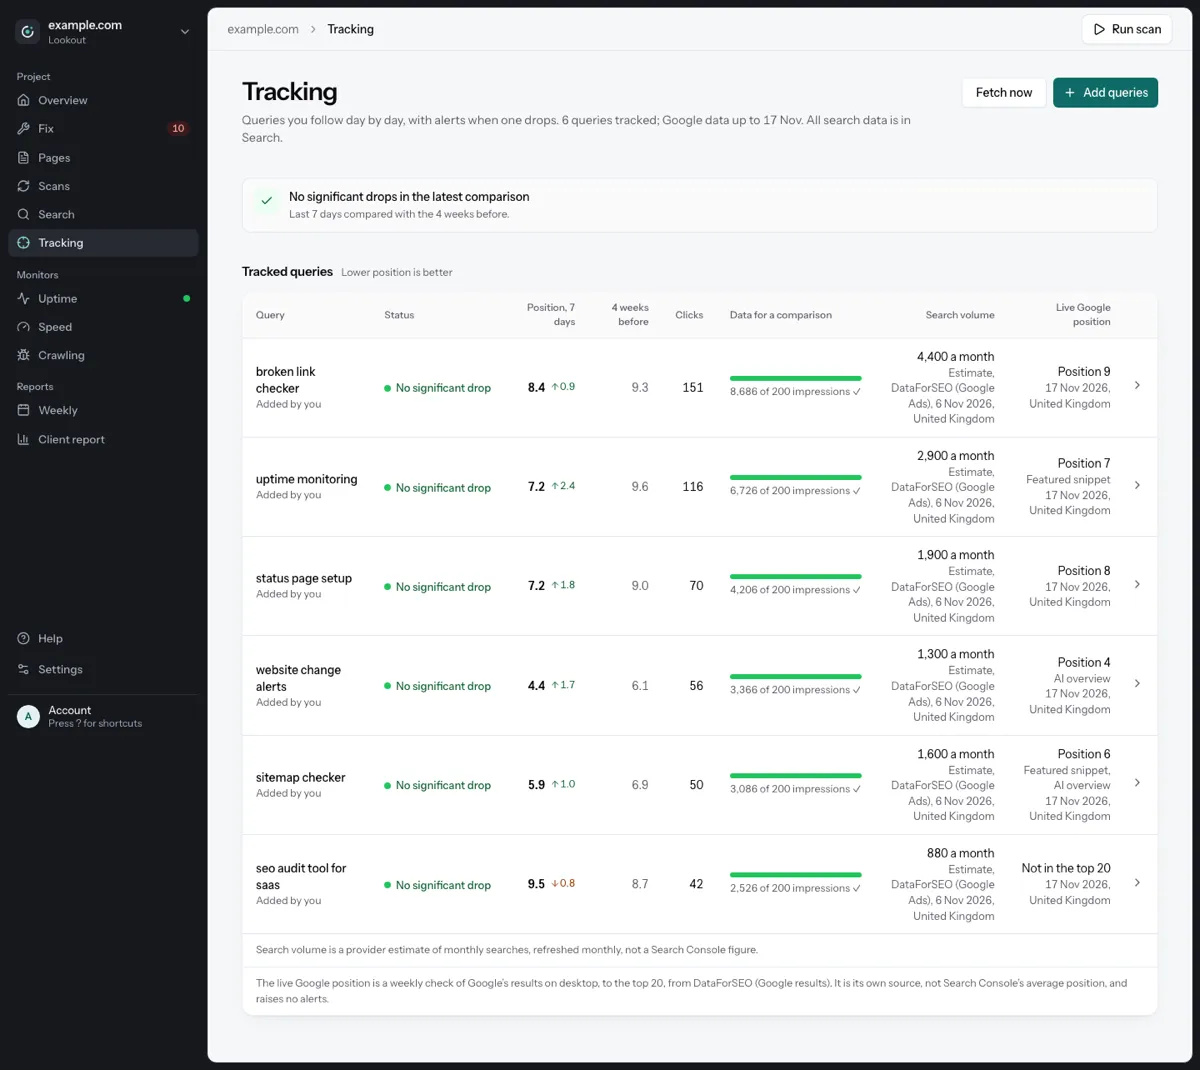
- Live Google positions. Once a week, each tracked keyword is checked against the top 20 desktop results in your top Search Console country. You see where your site ranks, and whether the results page shows a featured snippet, a local pack or an AI overview. This is shown beside Search Console's average position, never mixed with it. If your site isn't in the top 20, it says "Not in the top 20".
- Search volume. Each tracked query shows an estimate of how many people search for it each month, in your top Search Console country. A new query gets its figure at the next monthly refresh.
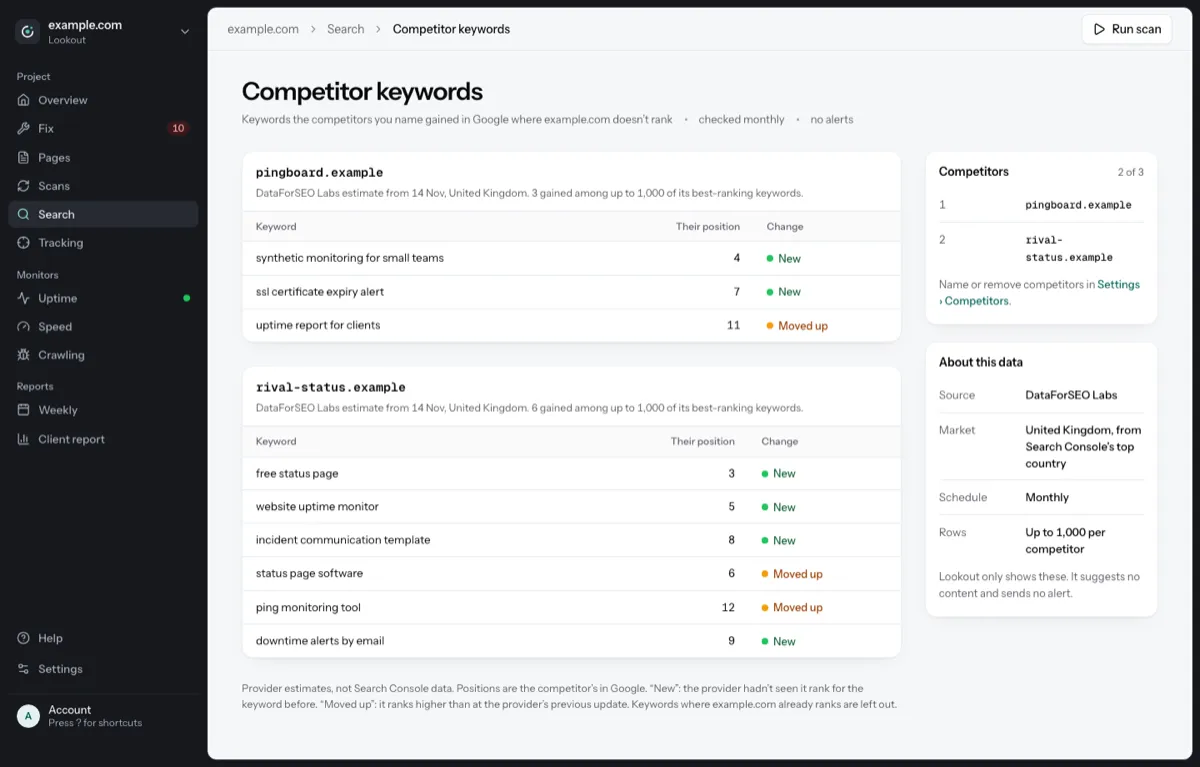
- Competitor keywords. Name up to three competitors in Settings. Each month, a Competitor keywords screen under Search lists the keywords they gained where your site doesn't rank, with their position and whether it is new or moved up.
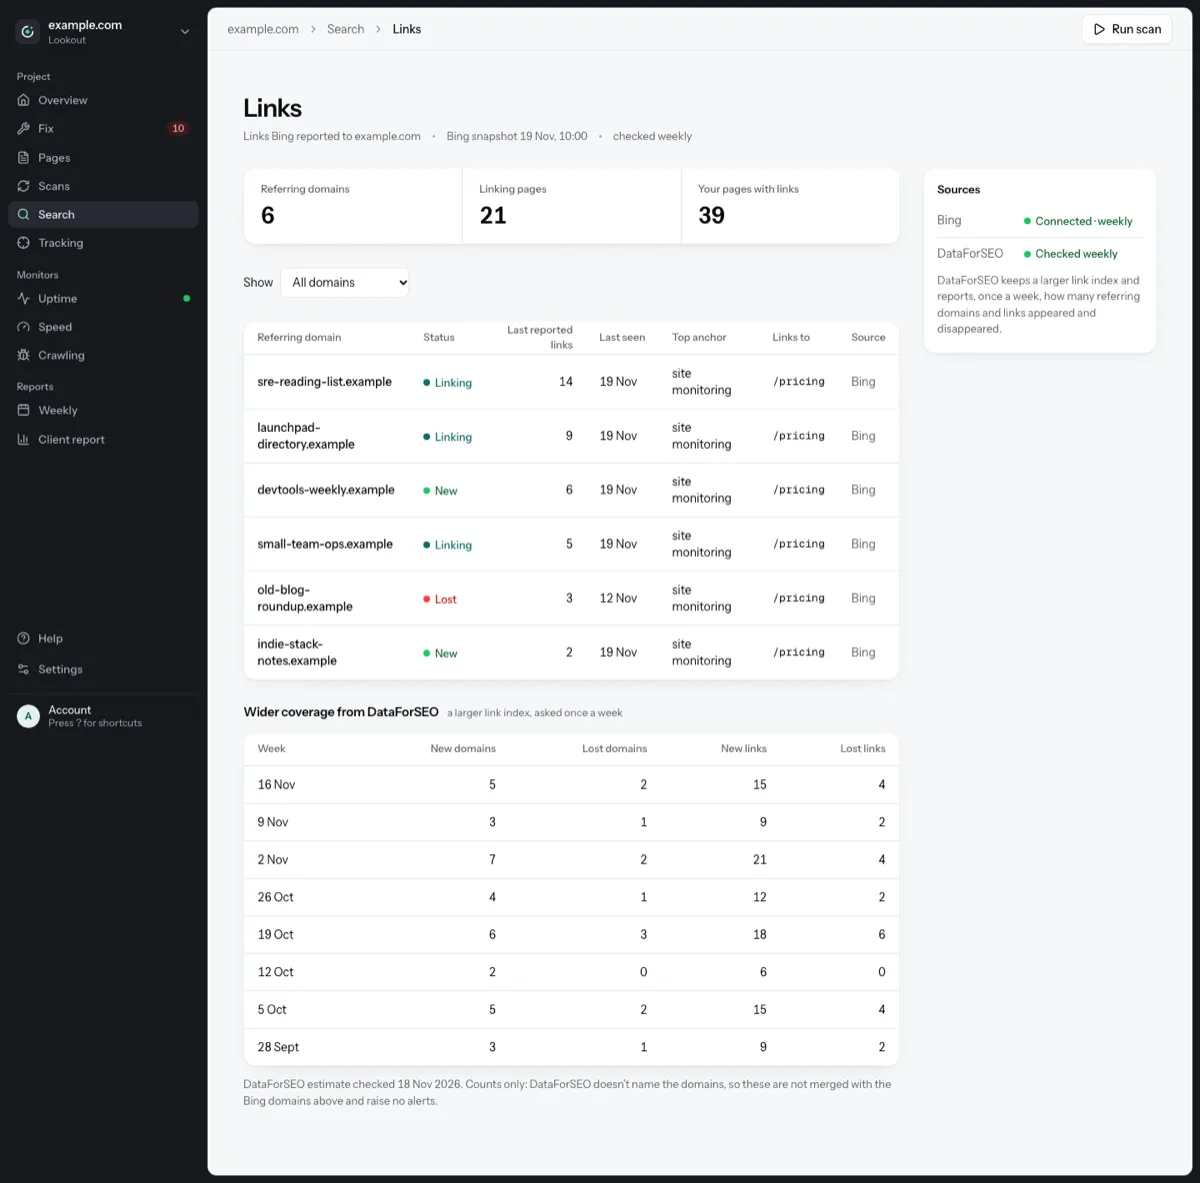
- New and lost links. The Links screen now has a weekly table of new and lost referring domains (other sites that link to yours) and new and lost links, below Bing's list. These are counts only: they don't say which sites.
Also new in Lookout
- A robots.txt tester. Under Crawling, test whether Googlebot, Bingbot or any other crawler may fetch a URL. It shows the exact rule that decides it, and you can paste a draft file to test before you change the real one.
- Ranking updates in alerts. A traffic-drop alert and the digest say when a drop started during a Google ranking update.
- Rich result checks. Structured data (code that describes a page to Google) is checked for the properties Google needs for ten kinds of rich result, the extra detail some search listings show. Google's own verdict from URL Inspection sits beside it.
- Soft 404 checks. A soft 404 is a page that works (it returns 200) but is really a "Page not found" page. Lookout flags it only when the whole title or the first heading is a phrase like "Page not found" or "404", so a short real page is never flagged. It is advice only: it doesn't count towards your urgent problems or set off alerts.
Satzo
Satzo tracks a crypto portfolio across wallets and exchanges, and works out the profit or loss on what you sold. The screenshots below use demo data.
Profit and loss
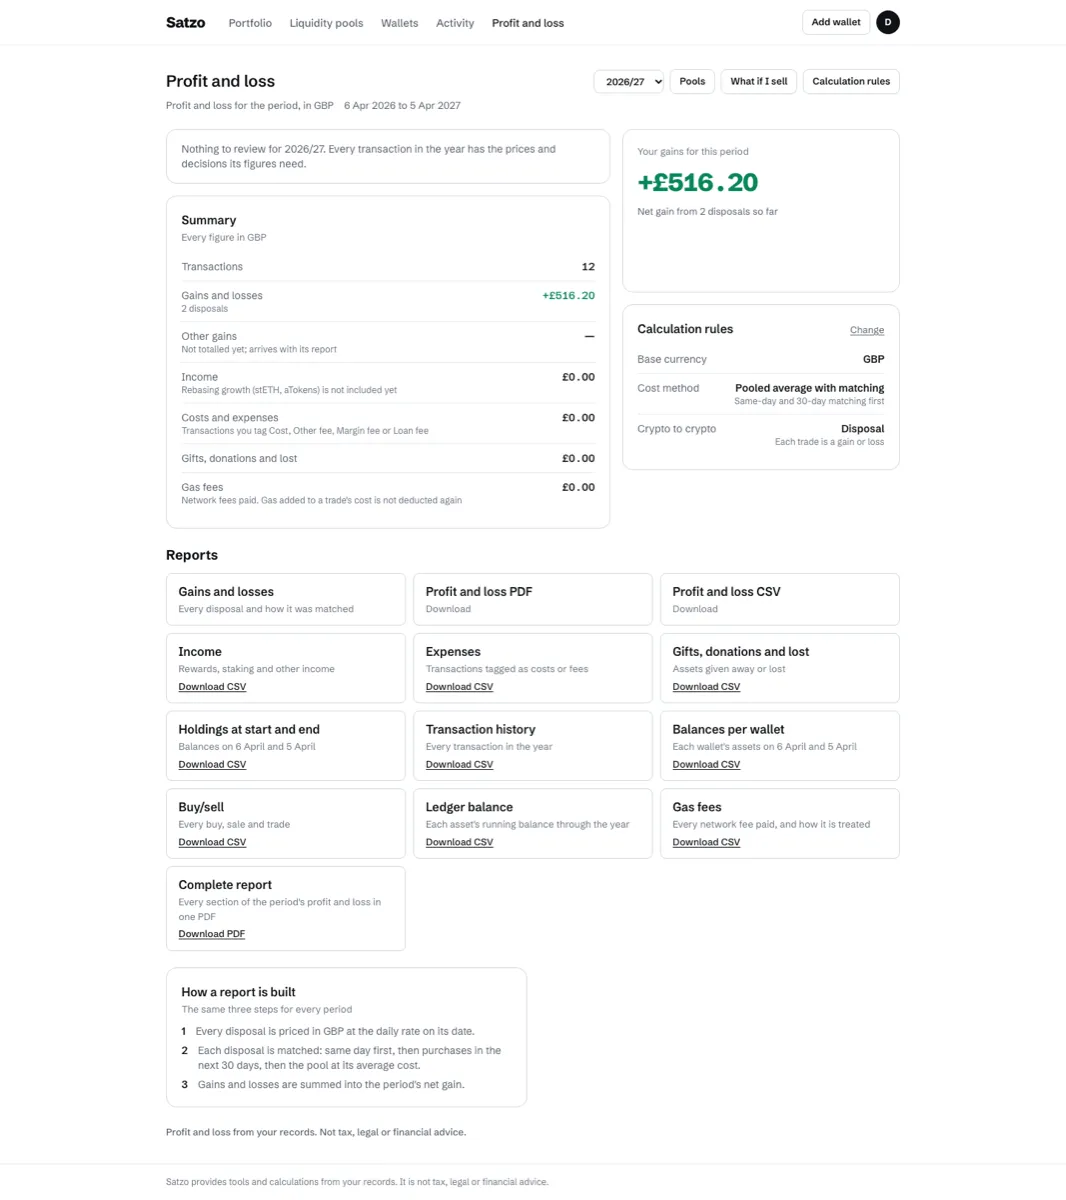
Satzo works out the profit and loss on your crypto wallets. The Profit and loss page shows your net gain for the year, from 6 April to 5 April. Below it are a summary of your transactions, gains, income, costs and gas fees, and the reports you can download.
You can also set a threshold: an amount you want to compare your net gain with. When you set one, the report shows a meter of your net gain against it, and the Transactions page says how far above or below it you are. Leave it blank to turn it off.
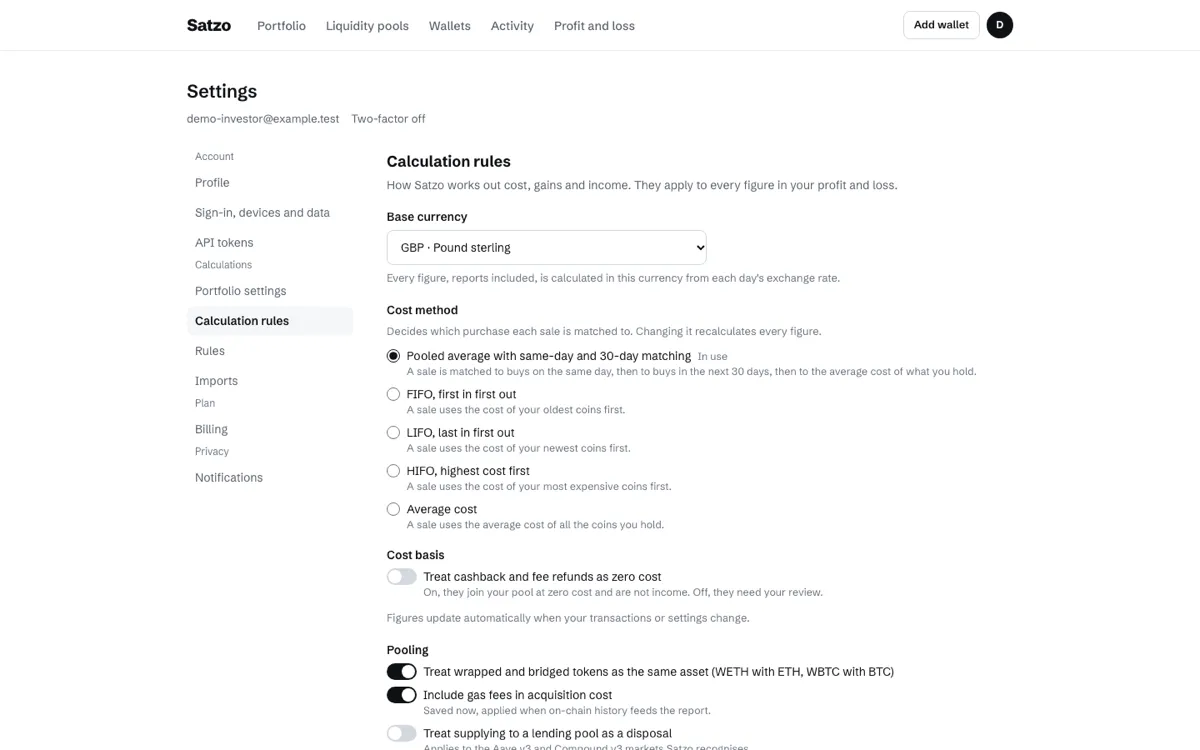
Choose your cost method
When you sell a coin, the profit depends on which purchase you count it against. Satzo now lets you choose how it decides. In Settings there are five methods:
- Pooled average with same-day and 30-day matching: a sale is matched first with buys on the same day, then with buys in the next 30 days, and the rest is costed at the average of everything you hold. This is how Satzo worked before, and it stays the default.
- FIFO: the first coins you bought are sold first.
- LIFO: the last coins you bought are sold first.
- HIFO: the coins you paid the most for are sold first.
- Average cost: each sale costs the average price of what you hold at that moment.
Each report records the method it used, and it is named in the CSV and PDF exports. That way, a report you saved earlier still says how it was worked out.
More exchanges, and Koinly
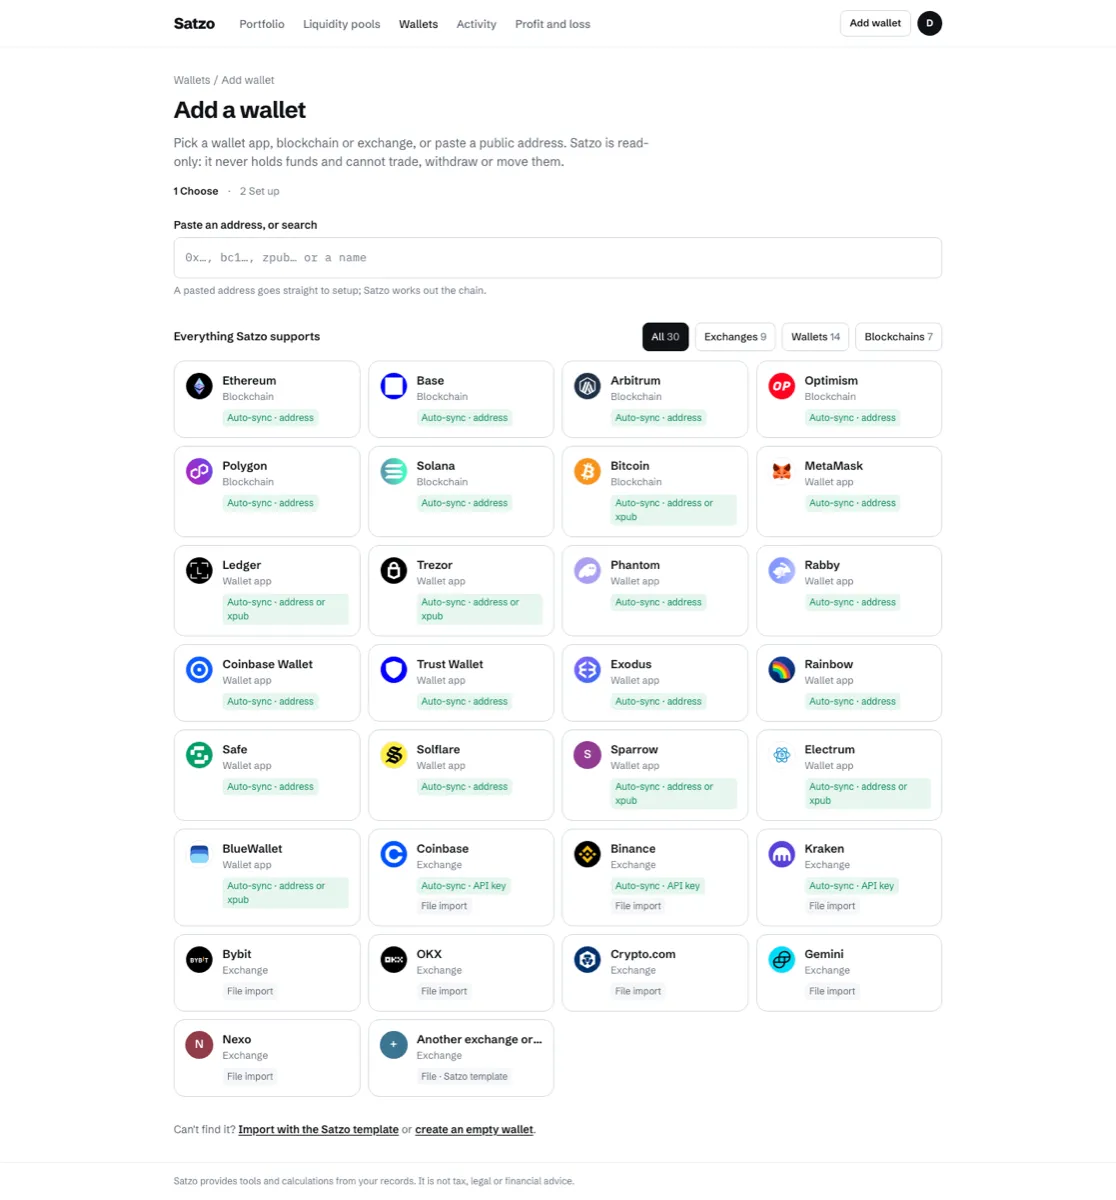
Satzo now reads export files from Bybit, OKX, Gemini, the Crypto.com App and Nexo, each with its own tile in the import catalogue. All five work from export files. There is no API key connection for them.
If you are moving from Koinly, Satzo can now read Koinly's Transaction history export as real transactions, up to 25 wallets at a time. Each Koinly wallet becomes an account, or goes into one you already have. A coin moved between two of your Koinly wallets becomes a pair: a withdrawal from one and a deposit into the other. Each Koinly label that has a Satzo meaning becomes that tag.
A new help page lists every supported exchange and how to bring its history in.
Fix an imported transaction
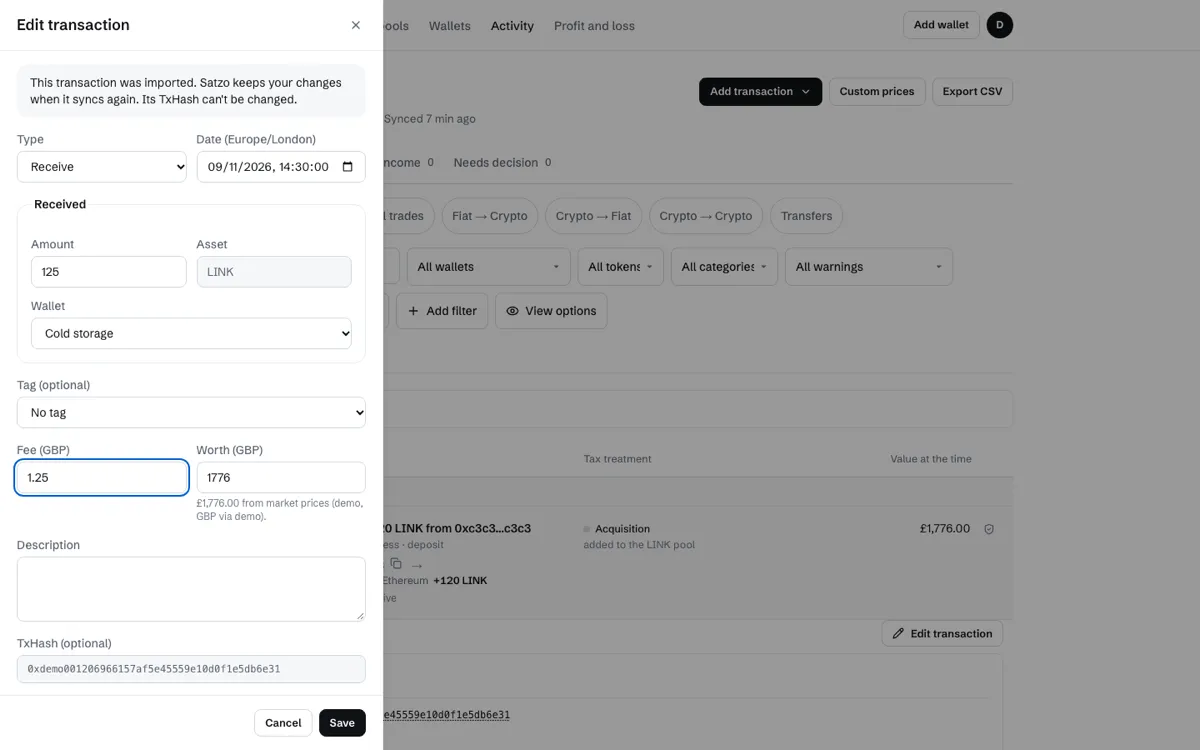
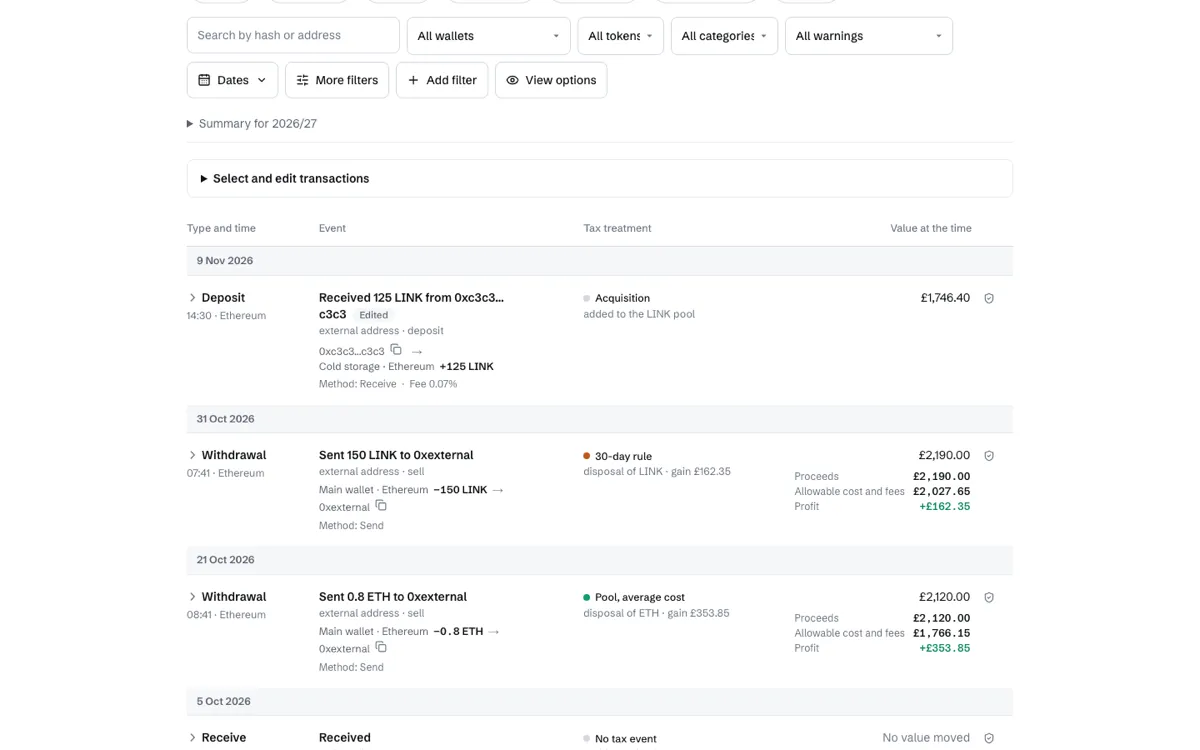
You can now edit an imported transaction's date, amount, fee or wallet. This works on an imported transaction with a single part, not on one you added by hand or one combined from several rows. The list marks it Edited, and a later sync keeps your edit instead of putting the old figures back. If you change the date or amount, Satzo works out its value again from the price on the new day. A value the exchange gave, or one you set yourself, stays as it is.
NFTs
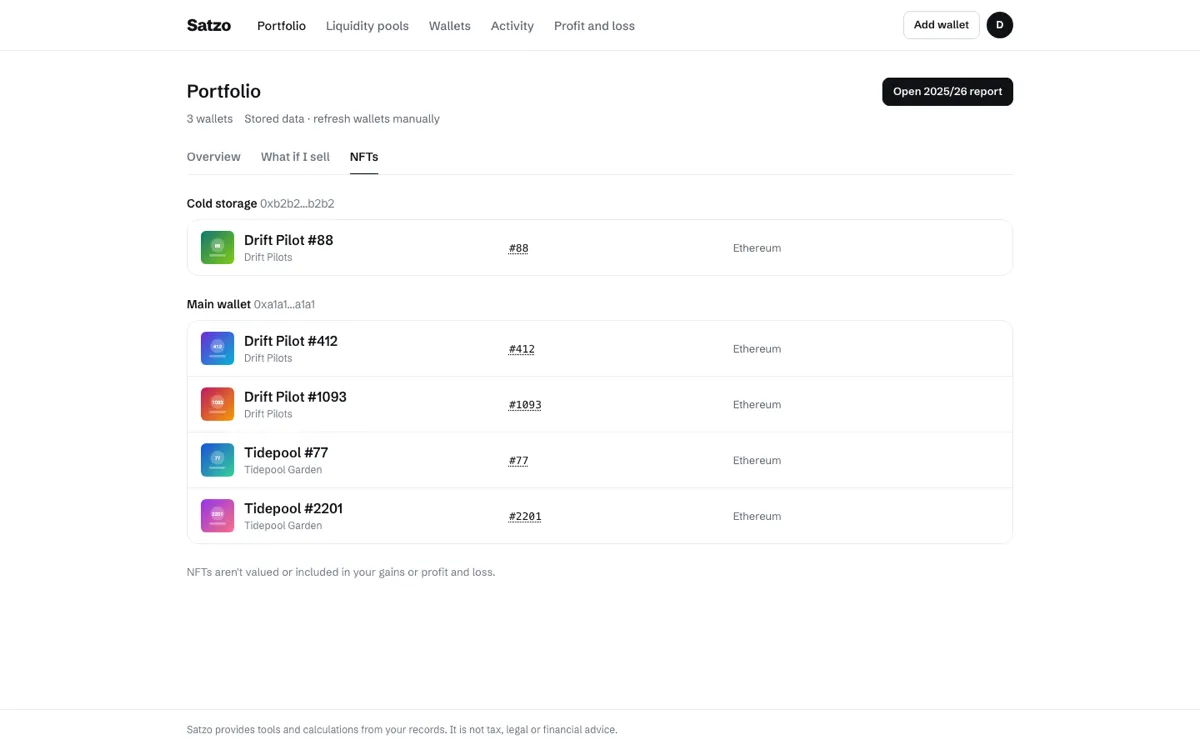
The NFTs tab now lists the NFTs each wallet holds, on Ethereum-style networks (Ethereum and the networks that work like it) and on Solana, including Solana's compressed NFTs. On Ethereum-style networks, each NFT shows its image, its name and a link to a block explorer. NFTs have no value in Satzo, and they are kept out of profit and loss.
Liquid staking
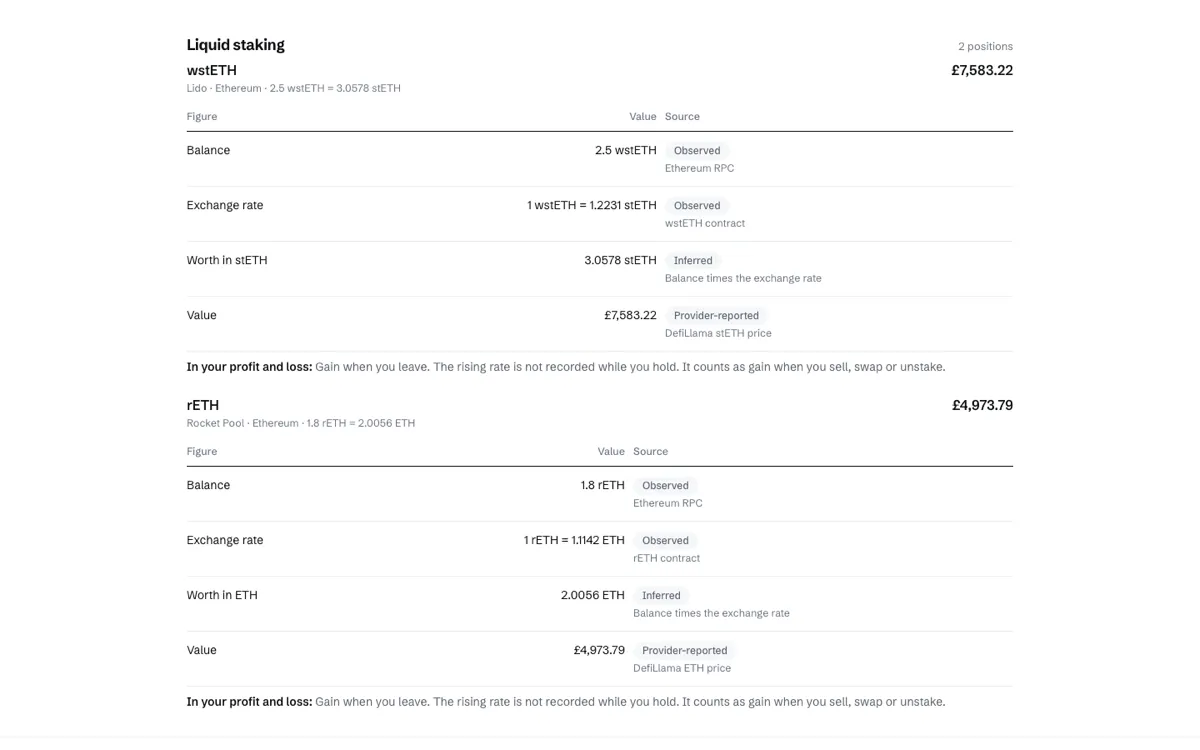
Liquid staking tokens are what you get back when you stake ETH or SOL through a service like Lido or Jito. They grow in value as staking rewards build up. Satzo now reads six of them: wstETH, weETH, wBETH, rETH, cbETH and JitoSOL. They show as cards on the DeFi tab and in the portfolio. Each figure says where it came from: read from the blockchain, reported by a provider, or worked out by Satzo. In profit and loss, the rising rate isn't counted while you hold the token. It counts as a gain when you sell, swap or unstake.
Adding a wallet on the right networks
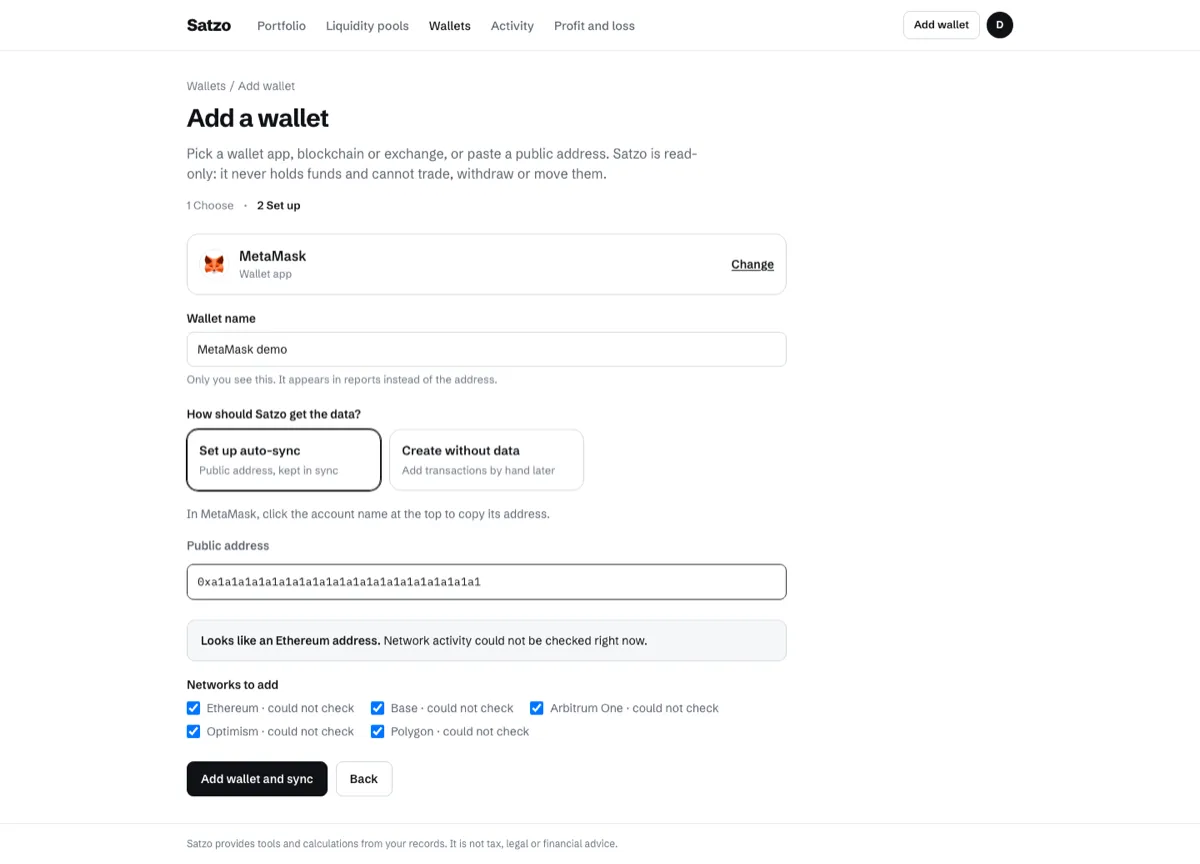
When you add an Ethereum address, Satzo checks which networks it has been used on. Each network gets a checkbox, with what the check found, such as "3 sent" or "none". Only the networks you tick are added, so an address doesn't fill your portfolio with empty accounts. Add wallet now shows brand logos for wallets, exchanges and networks.
Switchboard
Switchboard sends the emails a product needs: welcome emails, account emails, receipts and marketing. You set up automations that send an email when something happens in your app. The screenshots below use demo data, including made-up send counts.
One layout across the app
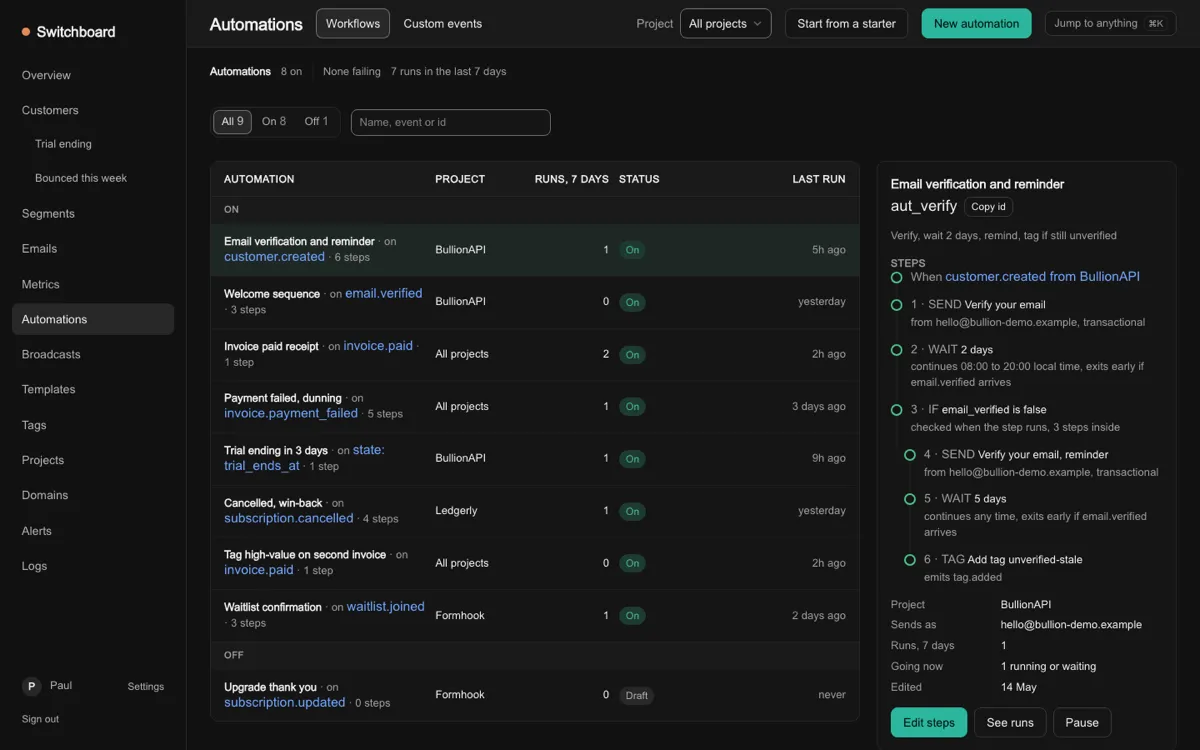
Switchboard now has one layout, in new dark colours. It adds:
- ⌘K search: press ⌘K to search customers, projects and automations, look up an id, or run the actions for the screen you are on.
- Keyboard shortcuts: g then a letter jumps to a screen, and j and k move through a list.
- Row menus: right-click a row for its actions.
- Side panels: click a row to see its details beside the list, without leaving the page.
- Undo: after some actions, a message offers Undo.
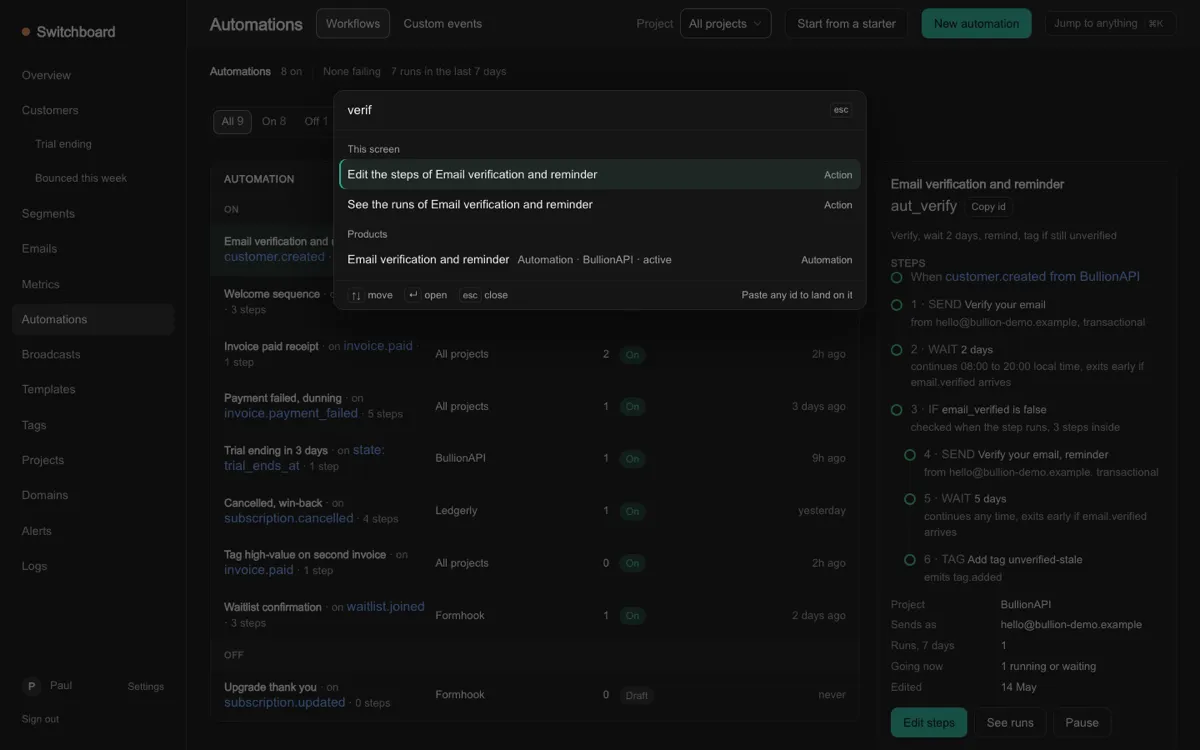
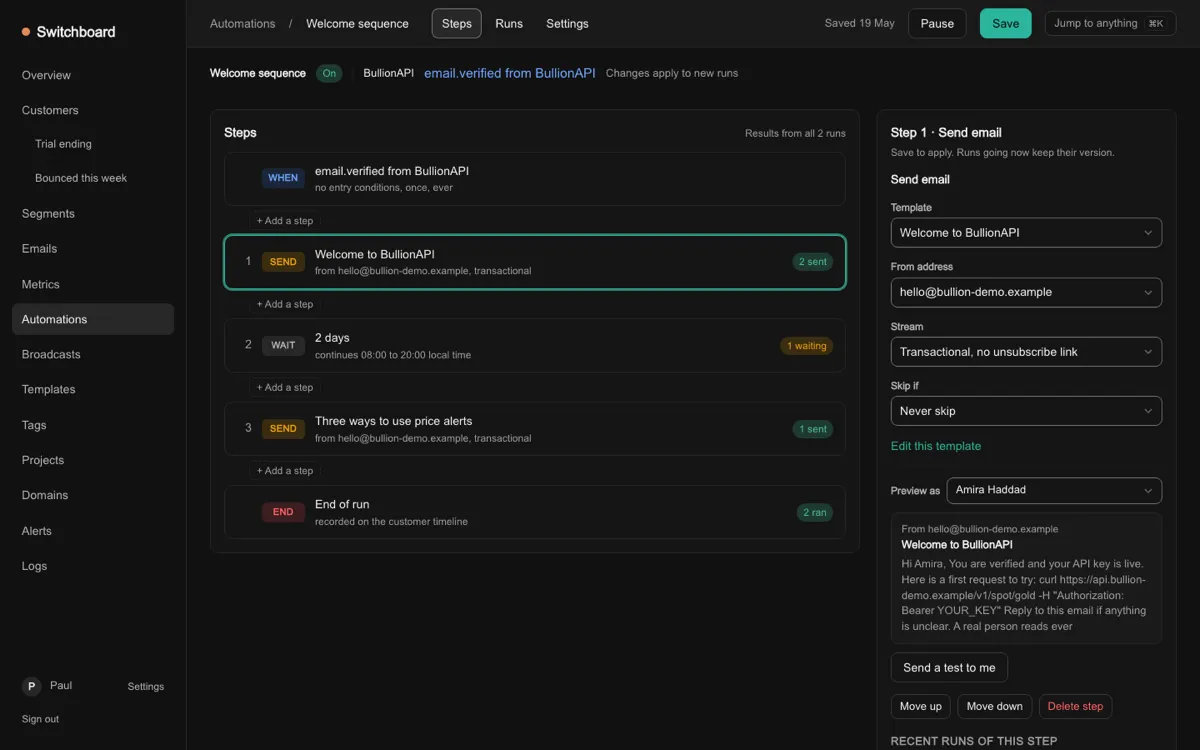
Automations, customers and segments, logs, connections and API keys, and sign-in are all redesigned. The automations list groups automations into Needs you (on, with a run that failed in the last 7 days), On and Off. An automation's steps are numbered, and each step shows what its last 200 runs did there. A send step can preview the email as one of your customers would get it, or send a test to you.
Start from a starter
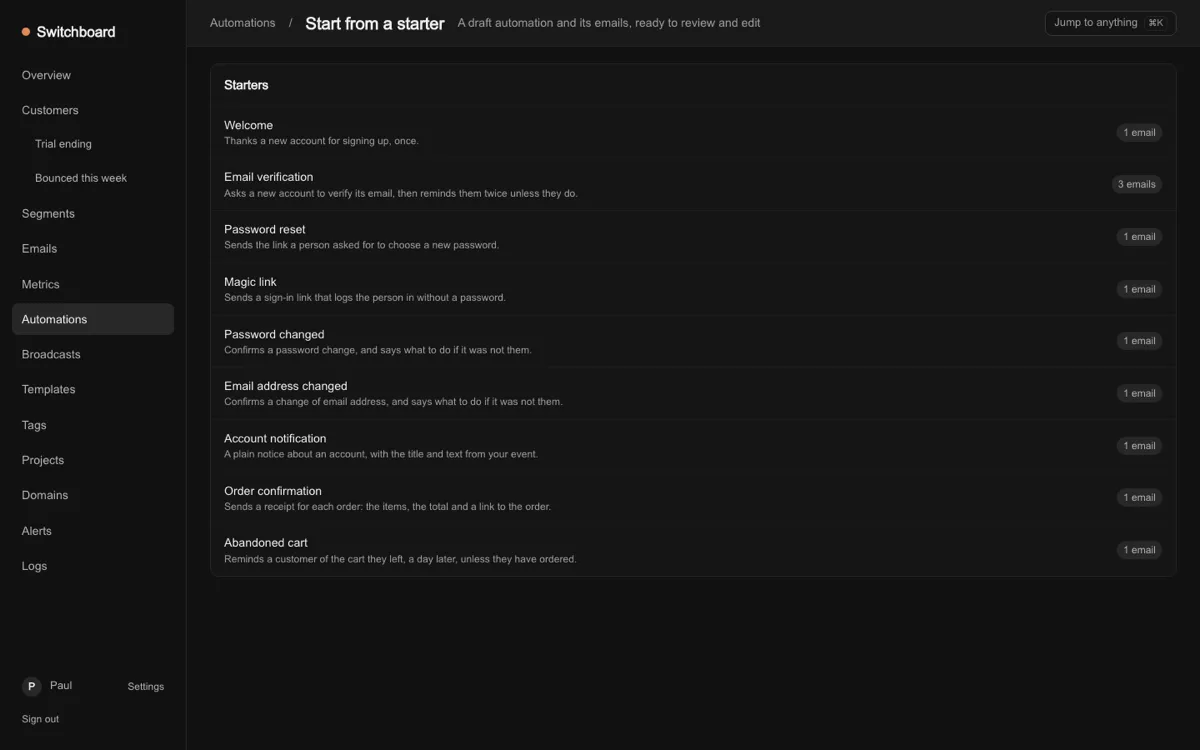
A starter creates an automation and its email templates for you. It makes draft copies, so nothing sends until you turn it on. There are starters for:
- a welcome email;
- six account and security emails: verify your email with reminders, password reset, magic link, password changed, email changed and an account notice;
- an order confirmation;
- an abandoned cart reminder.
Help with DNS
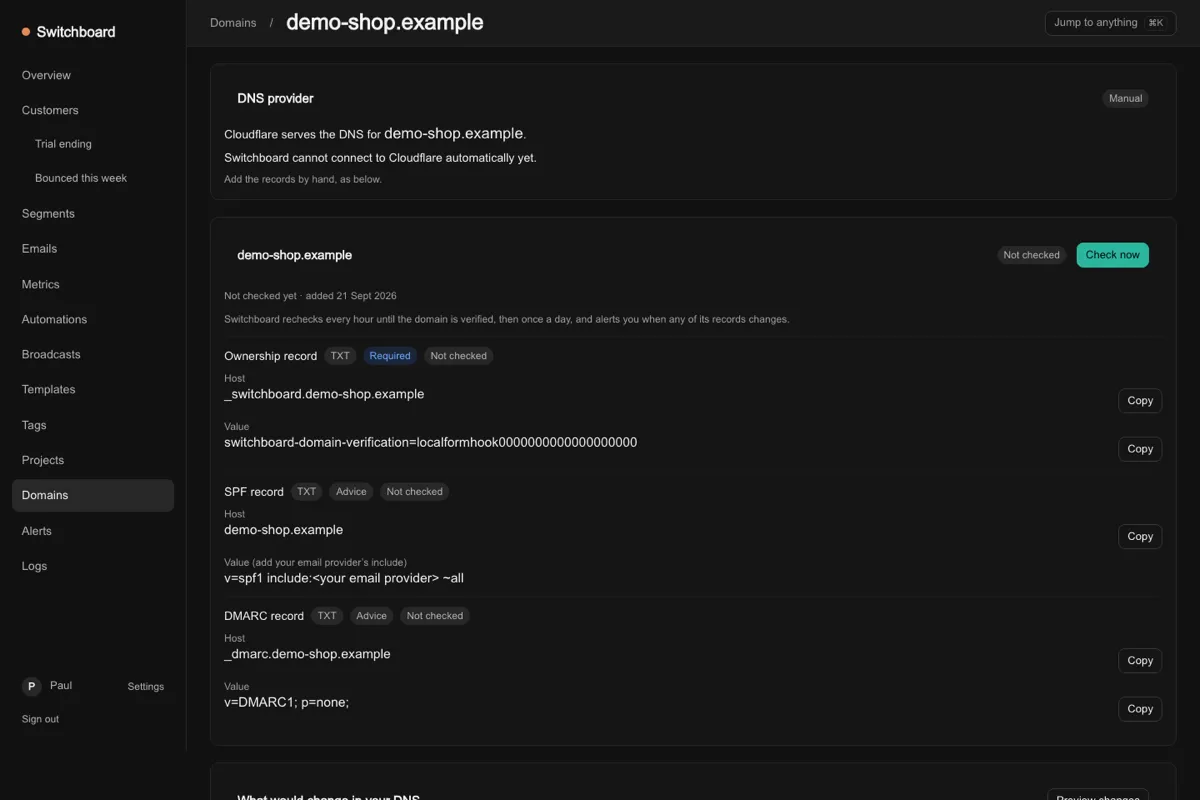
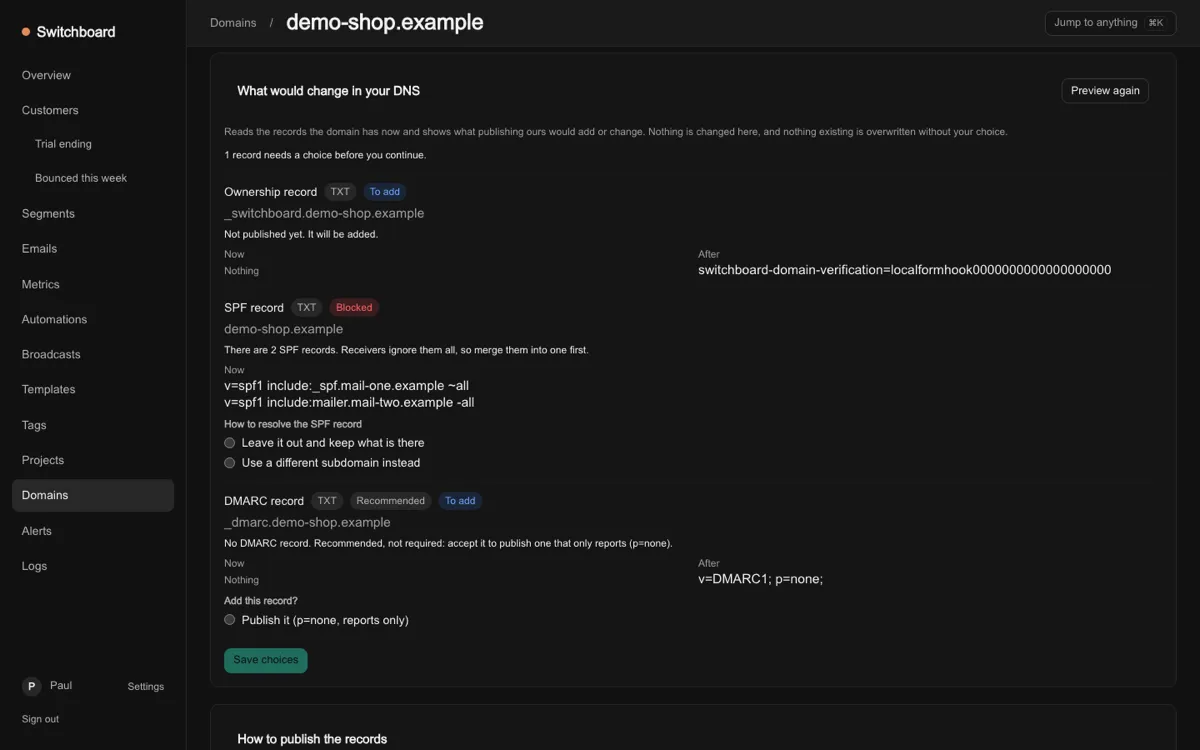
To send email from your own domain, you add a few DNS records where your domain is managed. Switchboard now finds who runs your domain's DNS. It recognises Cloudflare, GoDaddy and IONOS, and for any other it shows the steps to do by hand. It doesn't change your records for you yet: you still add them yourself.
Before you change anything, Switchboard shows a preview of the records it needs: which ones to add, which to change, and where one clashes with a record you already have. Each clash needs a choice before you go on. If you already have an SPF record, Switchboard merges its part into that record. It doesn't add a second one.
Once a domain is verified, Switchboard checks its records every day. If one changes, the owner gets an alert, and a banner shows on Domains.
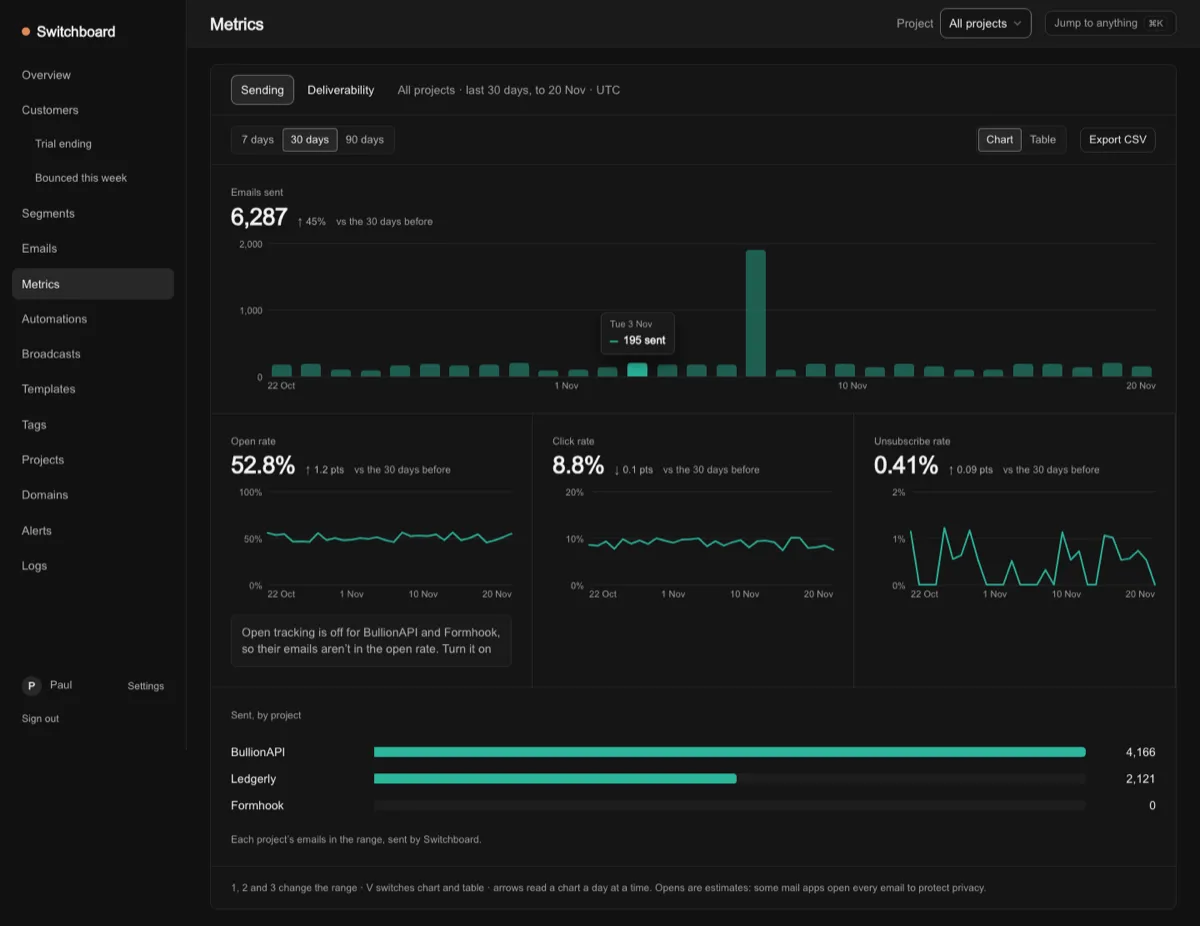
Metrics
A new Metrics page charts your email numbers by day: sent, bounced, complaints, opens, clicks and unsubscribes. Hover over a chart to see the figures for a day, press 1, 2 or 3 to change the date range, or switch to a table.
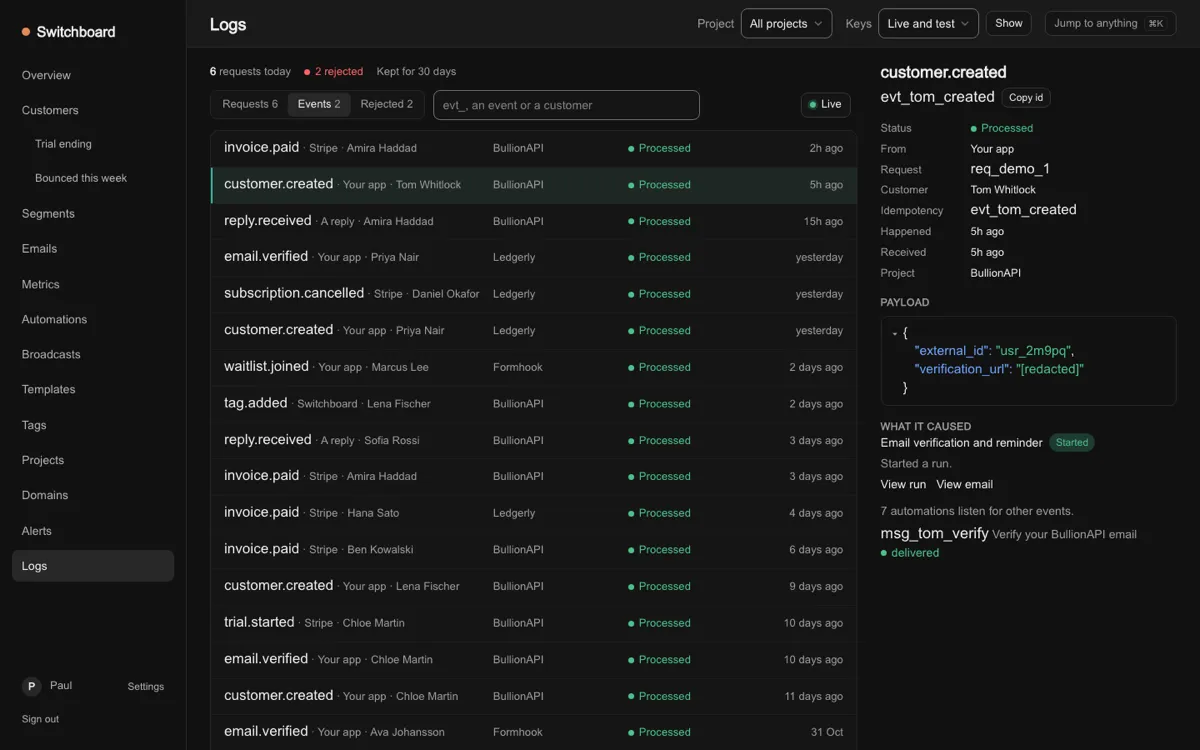
Follow an event to the email it sent
When your app sends Switchboard an event, such as "user signed up", you can now follow it from start to finish. In Logs, an event's panel lists every automation listening for that event, and whether it started. If one didn't, it says why: it was paused or still a draft, its conditions didn't match, or its run rules stopped it. From there you can open the run, each step, and the email exactly as it was sent. Events from before this change show their runs, without the reasons.
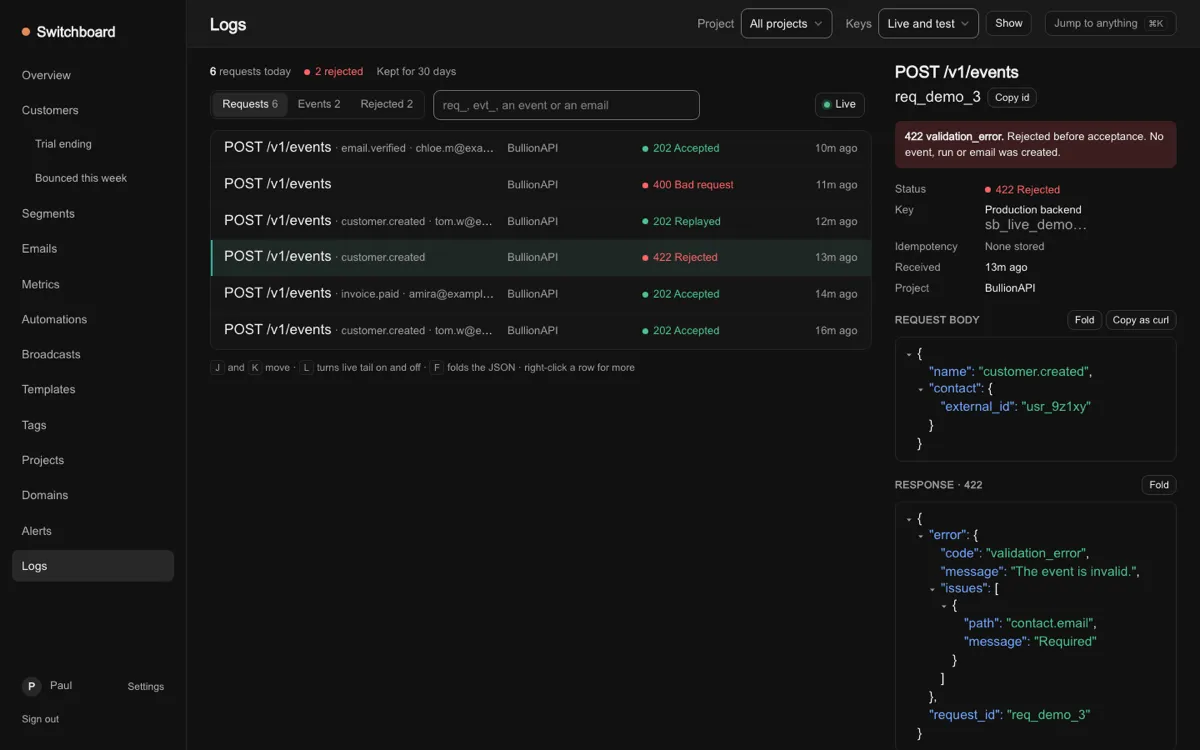
Logs
Logs has a live tail, so new requests appear as they arrive. It pauses itself after 10 minutes, or when you switch to another tab. Click a request to see the request, the response and the event in a side panel, as folded JSON you can open a bit at a time. Copy as curl gives you the request ready to paste into a terminal.
Customers
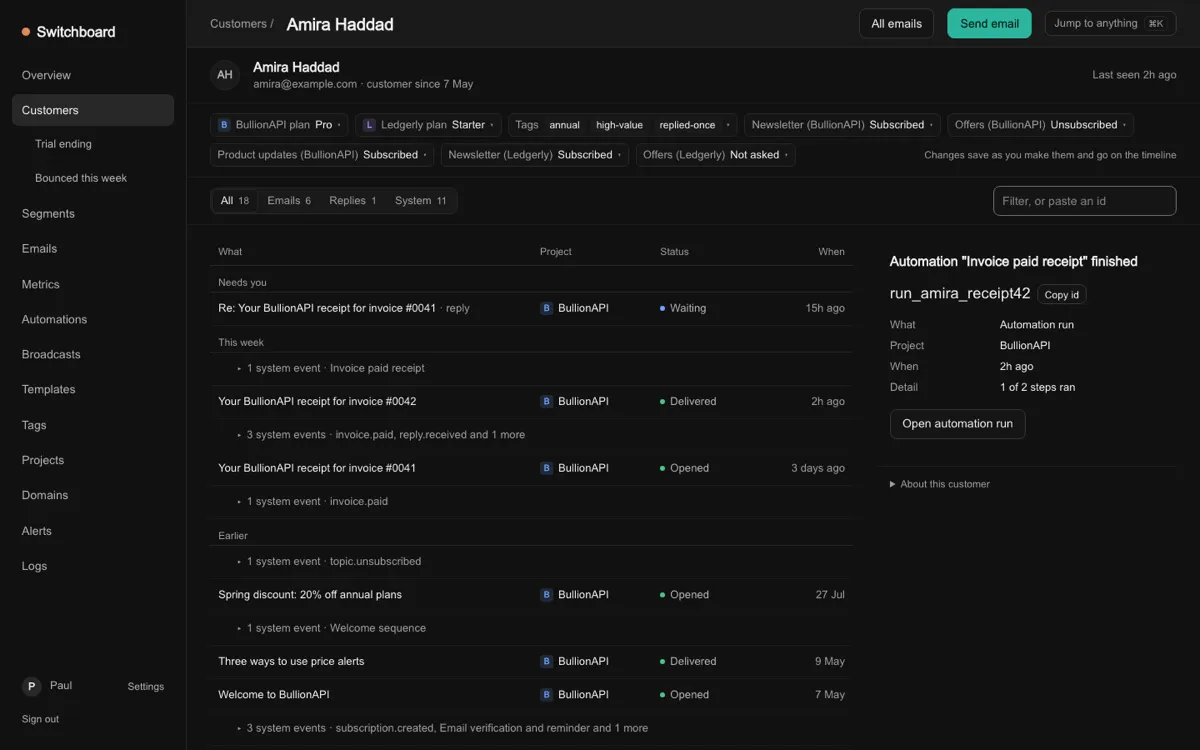
The customer page shows one timeline of everything Switchboard has done for that person, across your products: emails, replies and system events. Next to it is an About panel for each product. You can change a customer's plan and tags in place, and unsubscribe them from a topic, each with Undo. The plan is locked to Stripe while they have a live subscription, and only the customer can subscribe themselves. The customer list can be filtered, and you can save a filter as a view the whole workspace shares.
The pages your customers see
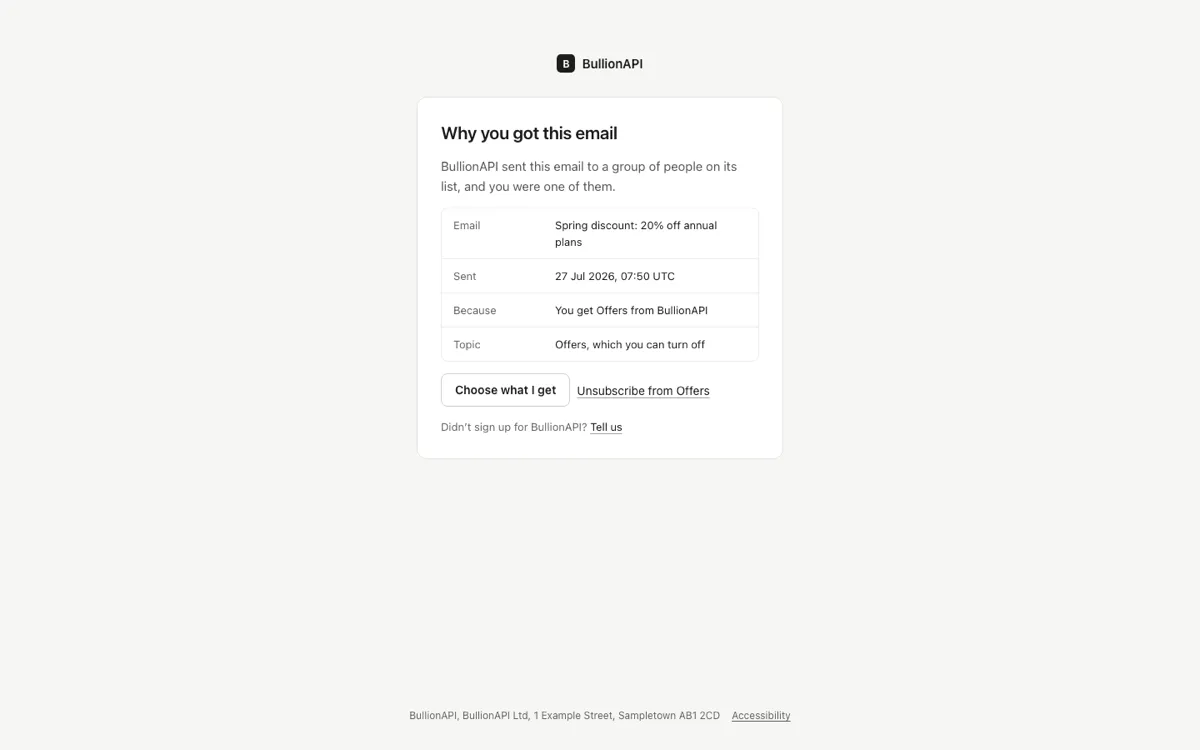
The pages your customers see, such as unsubscribe and email preferences, are redesigned too. Marketing email now has a "Why did I get this?" link. It opens a page that says, in plain words, why that person got the email, and lets them leave that topic or report that they never signed up.
Keeping your sending safe
Switchboard now warns the owner when bounces (emails that don't arrive) or spam complaints climb. If the rate gets too high, it pauses marketing email until the rate recovers or the owner resumes it. A note on the Overview says why. Account emails, like password resets, still send.
A weekly summary
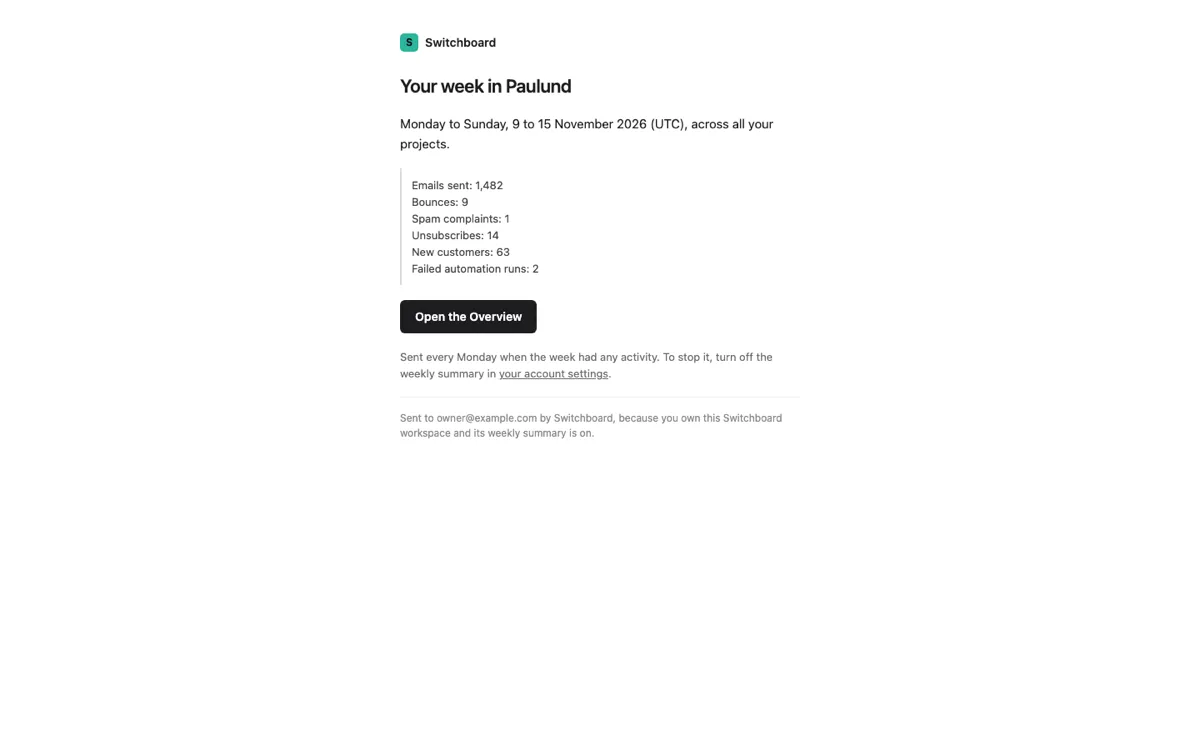
A workspace's first owner now gets a weekly summary email each Monday. It covers emails sent, bounces, complaints, unsubscribes, new customers and failed runs. Quiet weeks are skipped, and you can turn it off on the account page.
Bullion API
Bullion API serves gold, silver and other metal prices, along with central-bank gold holdings, interest rates and inflation, for your code or your AI assistant.
There are three new guides for using Bullion API with tools people already have.
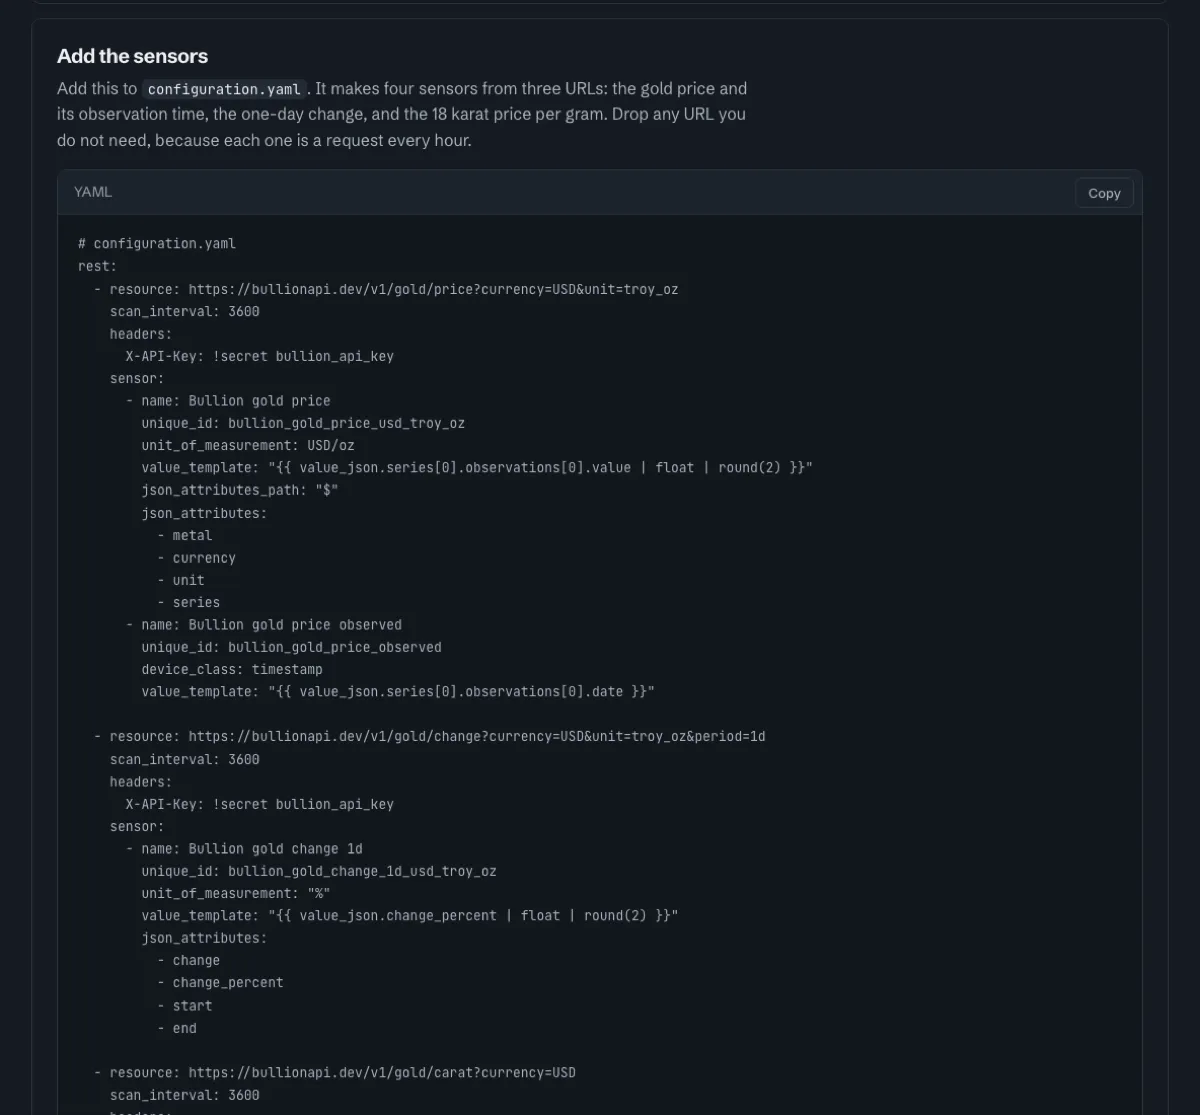
A Home Assistant guide
Home Assistant is a home automation tool. The Home Assistant guide adds metal prices as sensors you can show on a dashboard. Prices refresh hourly on weekdays.
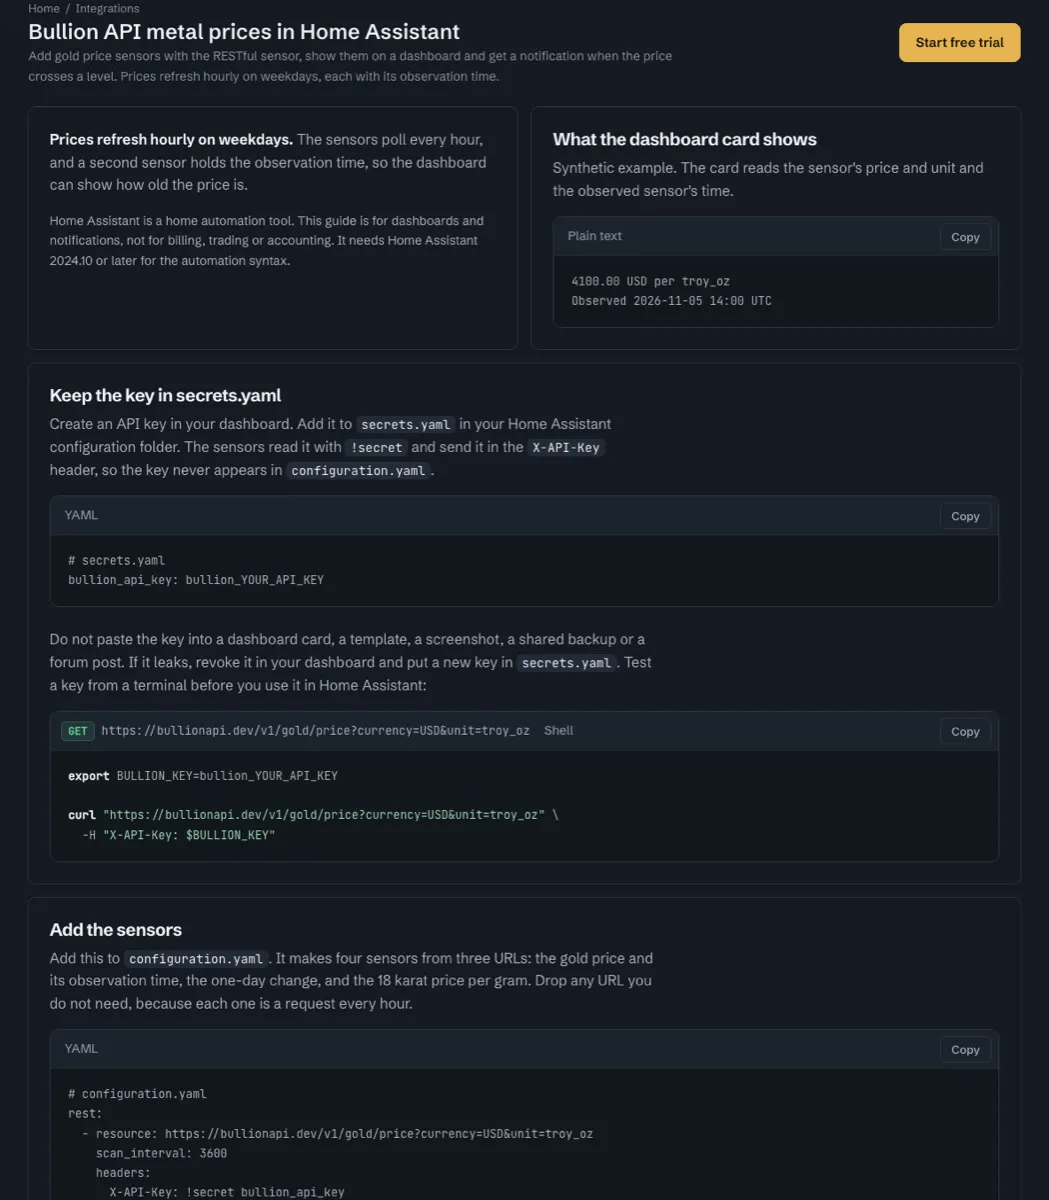
Do you run Home Assistant? I wrote a guide for adding gold and silver prices as sensors. The API key stays in secrets.yaml, the sensors poll hourly, and an automation sends a notification when a price crosses a threshold you set :)
The guide gives the full configuration to copy. It makes four sensors from three addresses: the gold price, when it was observed, the one-day change, and the 18 carat price per gram.
A WooCommerce setup guide
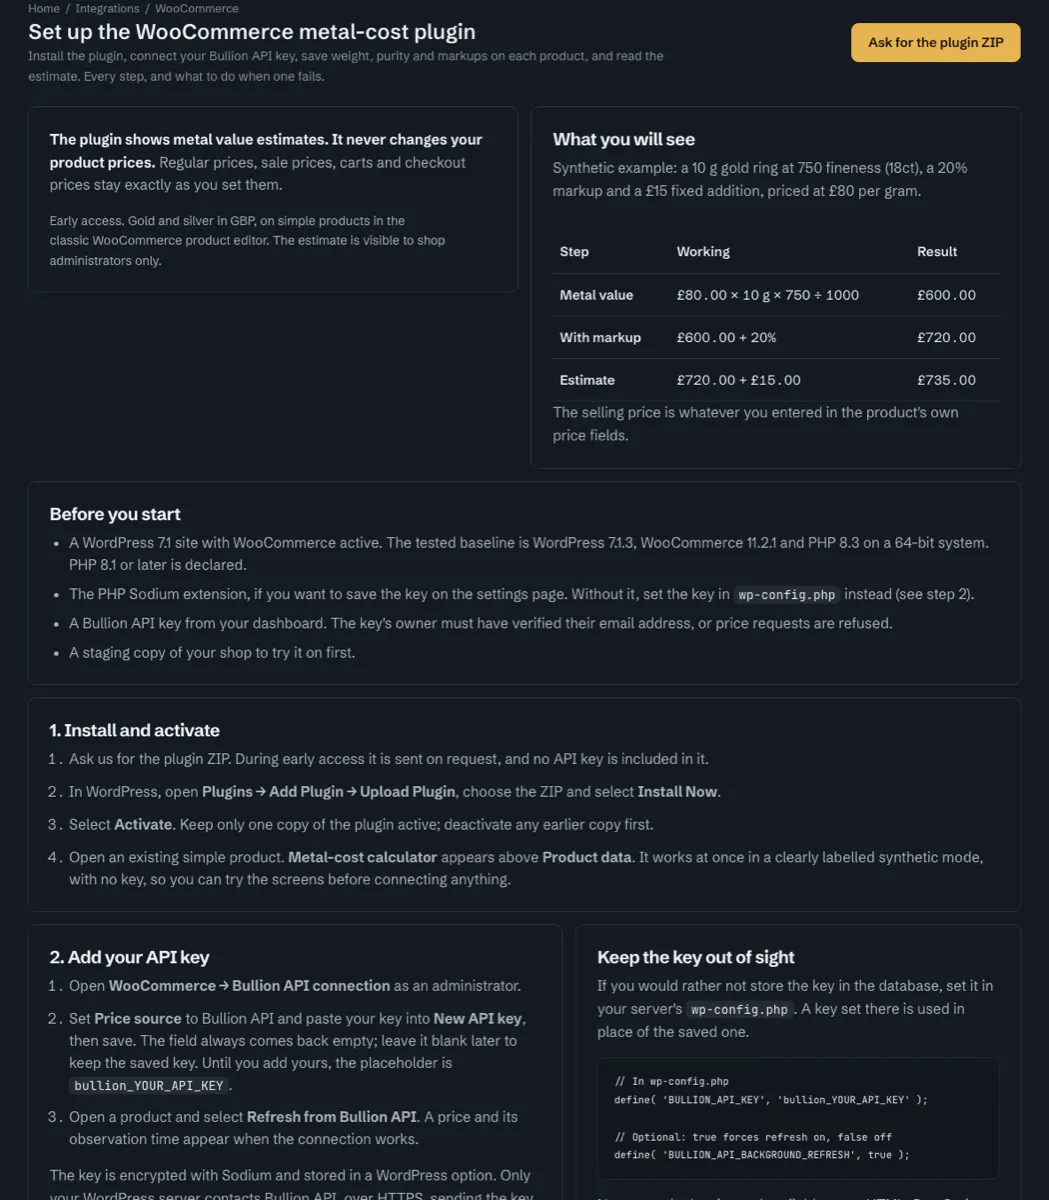
For shops that sell gold or silver jewellery, a WooCommerce plugin works out an estimate of a product's metal value from its weight and purity. Only shop administrators see it, and it never changes your prices. It is in early access: gold and silver in GBP, on simple products, and you ask for the plugin. The setup guide walks through setting it up, with a worked example: a 10 g, 18 carat gold ring.
Asking Claude or ChatGPT
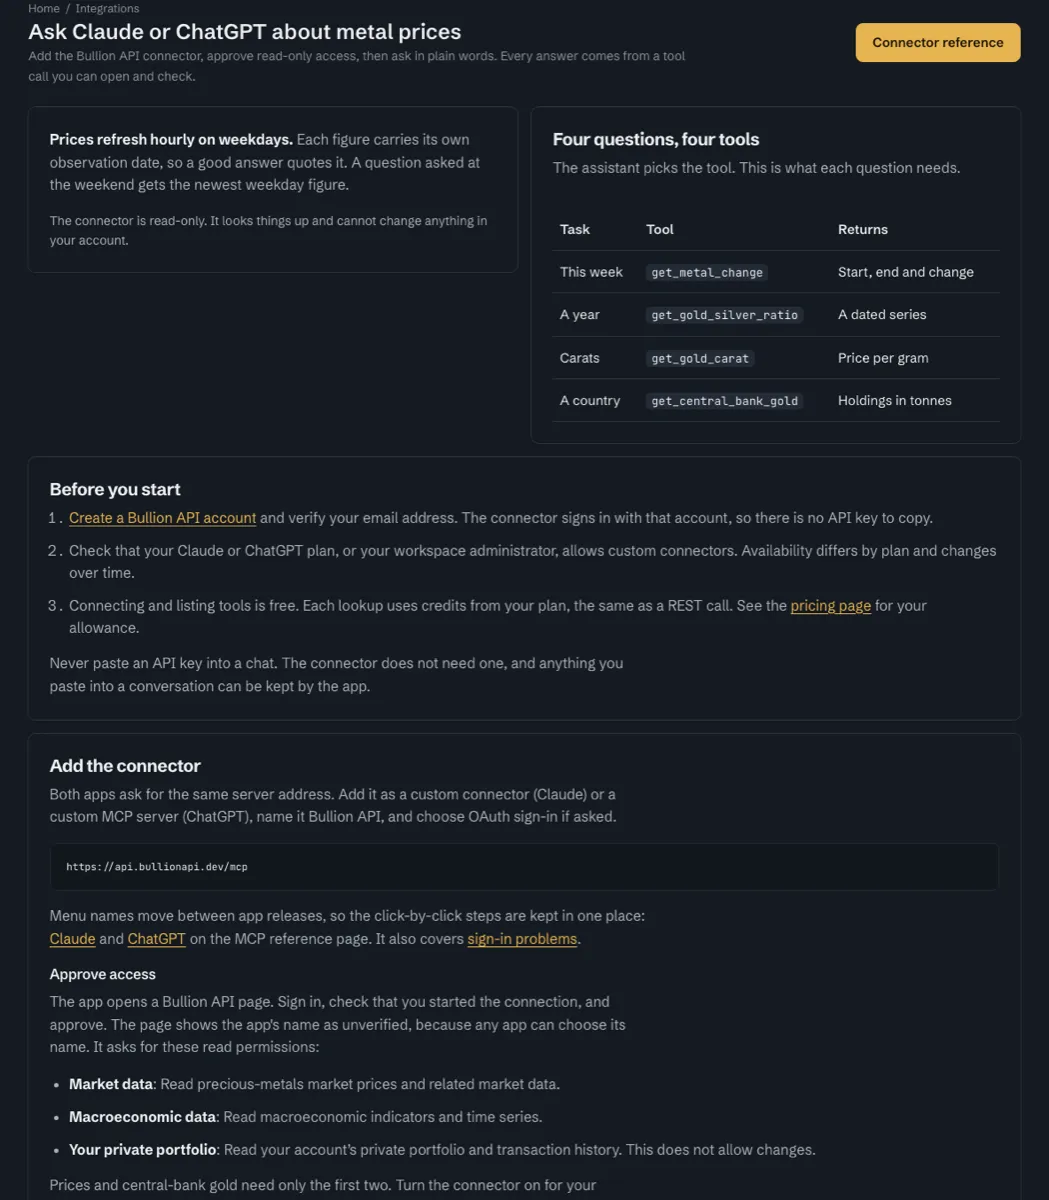
Bullion API has an MCP server, a way for AI assistants to call its tools. The Claude and ChatGPT guide shows how to add it to Claude or ChatGPT, then ask questions in plain English. It starts with four questions and the tool that answers each. They cover how a metal's price has changed, the gold to silver ratio, the price of gold at a given carat, and central-bank gold holdings.
Sweden
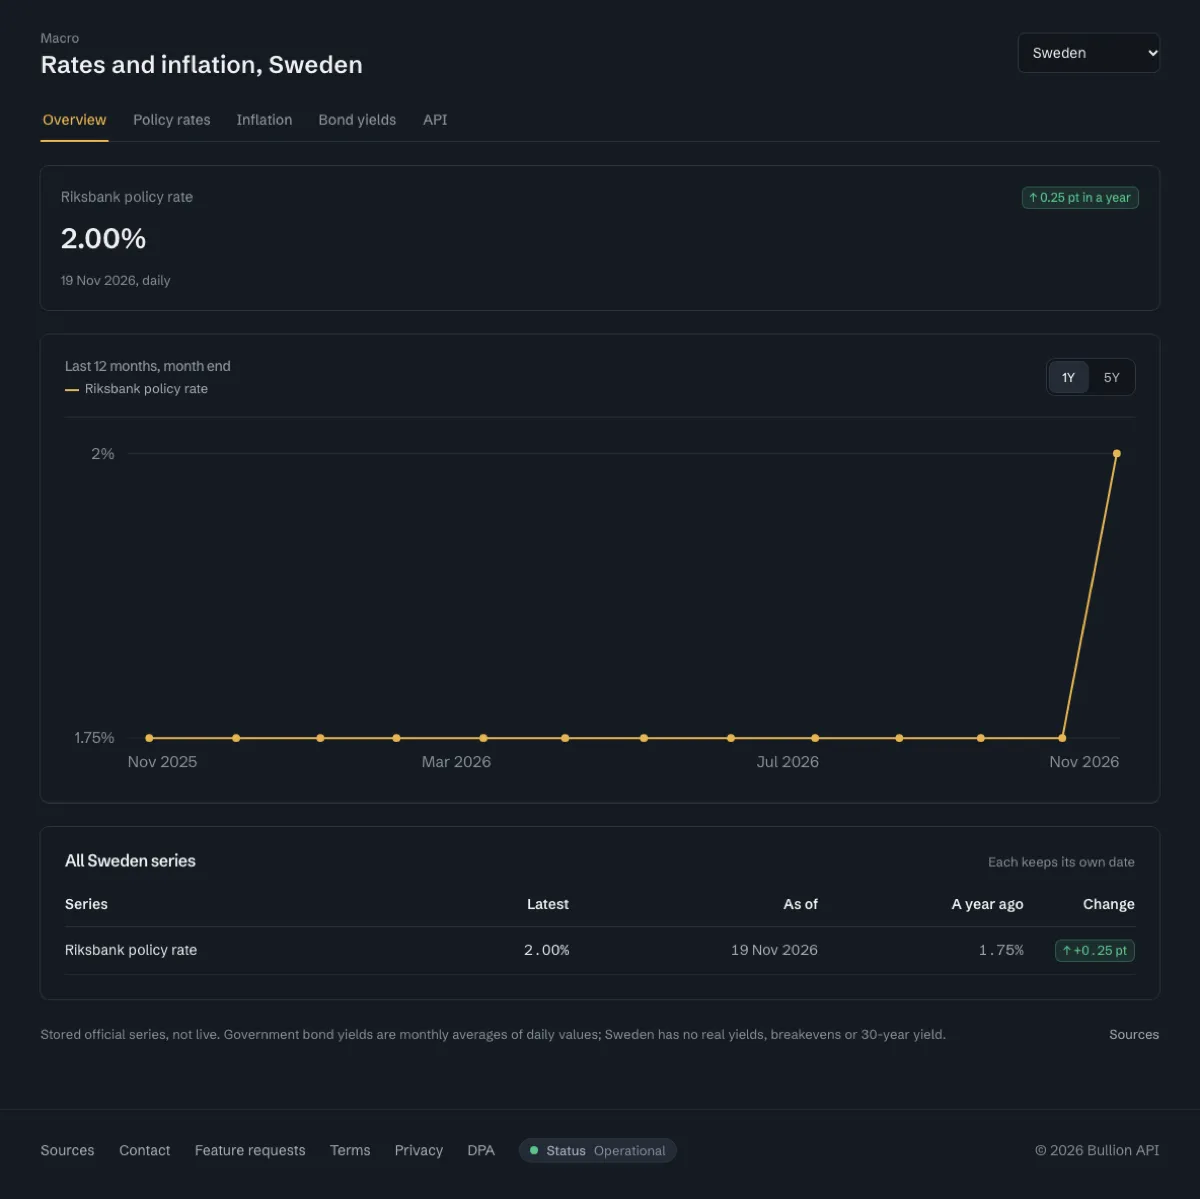
Sweden joins the macro pages and the money-supply page. Its macro page opens on the Riksbank's policy rate.
Where each figure comes from
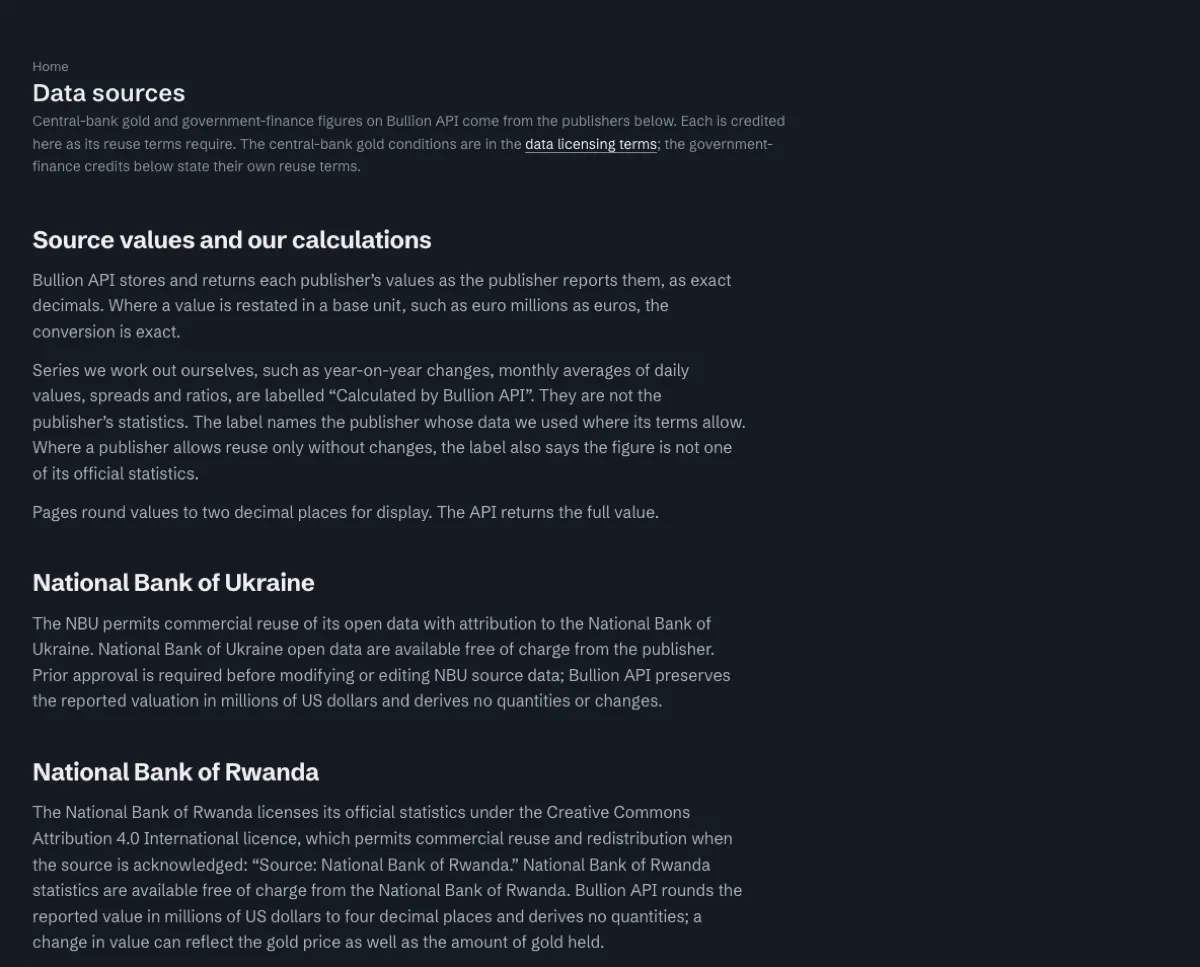
The dollar index now comes straight from the Federal Reserve Board, and US Treasury holdings from the US Treasury. Some figures Bullion API works out itself from published data. These are now labelled "Calculated by Bullion API", and name the publisher whose data was used where its terms allow. The sources page explains how they are calculated. Pages show values to two decimal places, and the API returns the full value.
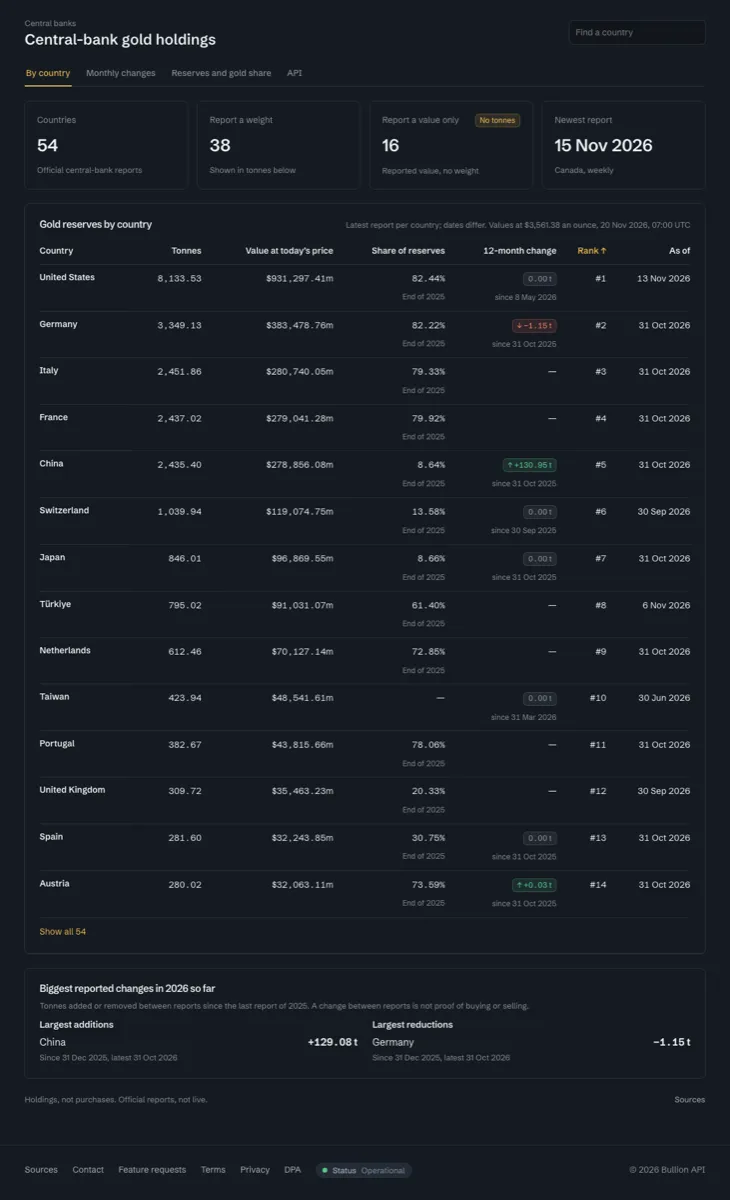
Central-bank gold by country
Central-bank gold holdings are now a table by country that you can sort by its columns. A panel below it shows the biggest reported additions and reductions in 2026 so far. Each country's page now answers common questions too.
A 30-day money-back guarantee
Paid plans now come with a 30-day money-back guarantee. You can ask for a refund from the billing dashboard.
Best tweets of the week
The three posts from 14 to 20 November that people replied to, liked and saved the most:
- 18 November: "Claude code has an experimental feature called Code mode you can try now by enabling a feature flag in your ENVs."
- 17 November: "Lookout found 14 pages on my site that robots.txt blocked and also marked noindex. A crawler that can't open a page never reads its noindex, so a link to it can still get the URL indexed. I unblocked them and kept the noindex."
- 18 November: "Google's Search Analytics API now has the filters Search Console already had. Branded vs non-branded queries (brandedClassification, eligible properties only), Lens and Circle to Search data (type webMultimodal), and several countries or devices in one request (filterLists)."
Bookmarks from the week
- Becoming a factory engineer: Ben Holmes on how software engineering has moved from writing code, to writing prompts, to engineering the system of agents that carries them out, and on using metrics to measure and improve an agent's quality.